


Introduction
Mushrooms are increasingly recognised as functional foods due to their nutritional and health-promoting properties. Among them, oyster mushrooms (Pleurotus ostreatus) are widely consumed for their valuable protein, vitamins, and minerals, vital amino acids, combined with low fat and calorie content.1,2 Their cultivation on low-cost agricultural residues further enhances their relevance as a sustainable crop that contributes to both food and environmental security.2,3 This combination of nutritional value and ecological benefits has positioned oyster mushrooms as an important food resource in many parts of the world. The demand for mushrooms has expanded steadily over the past decades. Global production exceeded 43 million tonnes in 2020, with oyster mushrooms accounting for nearly one-quarter of this output.4,5 Market projections indicate a further increase, with the global mushroom sector expected to approach USD 95 billion by 2028, driven by growing consumer awareness of their functional and medicinal properties (Fortune Business Insight, 2021). However, mushrooms are highly perishable, containing close to 90% water, and typically deteriorate within a few days under ambient storage.6 This short shelf life presents a major barrier for large-scale distribution, highlighting the importance of effective preservation methods.7 Drying is a commonly employed method for preservation of mushrooms, as it lowers water activity, extends shelf life, and simplifies handling, transport and long-term storage.8 Mushroom drying is a complex and nonlinear process, largely governed by internal moisture diffusion and shrinkage during the falling-rate period.9,10 Conventional thin-layer mathematical models, although widely used, often oversimplify the process and struggle to provide accurate predictions across different drying conditions or industrial scales.11,12 This limitation calls for advanced modelling techniques capable of capturing the nonlinear behaviour of drying kinetics more effectively.13
Artificial intelligence-driven approaches, including Artificial Neural Networks (ANN) and Adaptive Neuro-Fuzzy Inference Systems (ANFIS), have emerged as promising tools for validating appropriate mathematical models of the drying process for different agricultural products.14 ANN can model complex input–output relationships without requiring predefined equations, while ANFIS integrates neural learning with fuzzy logic, providing both accuracy and interpretability.15,16 Previous studies have demonstrated that these approaches outperform conventional models in predicting drying behaviour for agricultural products, including mushrooms.17,18 Beyond prediction accuracy, ANN and ANFIS hold practical value for large-scale mushroom processing. Industrial drying operations are influenced by variable airflow, temperature gradients, and product shrinkage, which complicate process control. Data-driven models can be integrated into real-time monitoring systems to optimise drying parameters dynamically, thereby reducing energy consumption and improving product quality. They can also guide the design and modification of mushroom dryers by simulating airflow distribution, tray configurations, and hybrid drying approaches before implementation.19 Such applications reduce experimental costs, enhance efficiency, and support the development of intelligent drying systems tailored to the delicate nature of mushrooms.20,21 Despite these computational advancements, previous studies on oyster mushrooms have primarily focused on conventional thin-layer empirical equations, which frequently oversimplify nonlinear moisture diffusion. While separate investigations have utilised either RSM, ANN, or ANFIS, a direct three-way predictive benchmark that evaluates the intersection of statistical regression, neural learning, and fuzzy logic remains unexplored for mushroom matrices.22 Therefore, the primary objective of this study was to evaluate the convective drying kinetics of oyster mushrooms under varying temperatures (50–70°C) and slice thicknesses (5–20 mm), and to establish the most robust predictive framework by directly comparing the accuracy of RSM, ANN, and ANFIS models.
Materials and Methods
Sample Preparation
Fresh samples of oyster mushroom (Pleurotus ostreatus) were collected from the local market in Jorhat, Assam and cleaned using a dry cloth to ensure free from dirt.
Drying Experiment
The mushroom drying was performed in the post-harvest processing Laboratory of the Department of Agricultural Engineering, Assam Agricultural University, Jorhat. A batch-type tray dryer was used for the study, with an adjustable temperature range from 50°C to 70°C. The drying time was manually controlled during the trials. Before loading the samples, the dryer was switched on and allowed to stabilise at the desired temperature. The mushroom samples, prepared to the required thickness and placed on petri plates, were then dried for the set duration. After drying, the samples were weighed using a digital weighing balance (Make: ANAMED Instrument Pvt. Ltd.) to record their final weight.
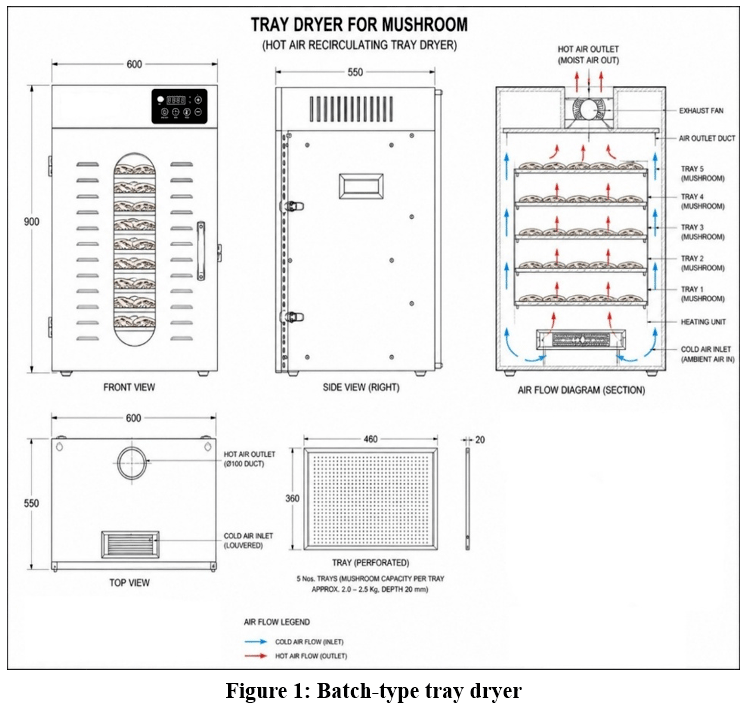 |
Figure 1: Batch-type tray dryer |
Drying Kinetics
The experimental design was developed using a randomised central composite design (RCCD) generated with Design Expert software (version 13.0.5.0). The core factorial levels (±1) were set at 5–20 mm for thickness, 6–10 hours for duration, and 50–70°C for temperature. To maintain rotatability, the design generated axial points (±α = ±1.682), expanding the operating boundaries to extreme limits of 4.59 and 21.41 mm for thickness, 4.6 and 11.36 hours for duration, and 43.18°C and 76.81°C for temperature, across a total of 20 distinct optimisation runs (Table 2). Moisture content readings were taken at half-hour intervals until equilibrium moisture content was reached. The moisture content (MC) on a wet basis (w.b.) was calculated using Equation 1:
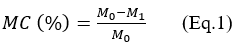
where MC = Amount of wet-basis moisture content, M0 = initial mass of the mushroom and M1= the mass after oven drying.
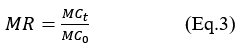
To analyse the behaviour of drying, curve fitting was performed to compare the experimental drying data with four empirical models at 50°C, 60°C, and 70°C. Kinetic analysis was carried out to understand the relationship between drying time and moisture ratio (MR). The moisture ratio was determined using Equation 2:

where MR = the moisture ratio, MCt = the moisture content at time t, MCe = the equilibrium moisture content, and MCo = the initial moisture content. Since MCe values were negligible compared to MCt and MCo, the moisture ratio can be simplified as represented in Equation 2.
Response Surface Modelling
Response Surface Modelling (RSM) is a statistical approach for optimisation of the drying process parameters and their influence on dependent variables. RSM typically employs regression analysis to build a polynomial model, most often a quadratic, for predicting the response across the experimental region. A randomised Central Composite Design (CCD) of the RSM was carried out considering moisture content as the dependent variable, whereas mushroom thickness, drying time and temperature were independent attributes. The data file was created in Design-Expert 13 software. The CCD consists of five design points, namely two axial levels (+α and –α), two factorial levels (+1 and −1), and a central level (0).
A second-order (quadratic) polynomial model, as represented in Equation 4,23 was expressed to effectively describe the relationship between the input data and the resulting response variables.

Where Y represents the response determined from the model, β0, βi, βii and βij were linear, quadratic, and interaction coefficients, respectively, and ε is the random error.
Model adequacy was evaluated using the lack-of-fit test, coefficient of determination (R²), and adjusted R². The F-test assessed coefficient significance. Regression coefficients were used to generate 3D response surface plots for estimation, and an optimisation was performed using a desirability function.
Artificial Neural Networks (ANNs) Modelling
The drying behaviour of oyster mushrooms for the ANN model was simulated using the Neural Network Tool of MATLAB R2023b. The model was developed using the Levenberg-Marquardt training algorithm, which is often considered the fastest. The Levenberg-Marquardt procedure was utilised in the backpropagation model, with the ‘trainlm’ function. The training process aimed to reduce the mean square error (MSE) of the network by using the gradient descent method.24,25 The dataset for drying under different input parameters was augmented fivefold to fit ANN modelling.26 This approach was adopted to prevent overfitting and to maintain an efficient convergence rate, which may be adversely affected by excessively large or small numbers of neurons, respectively.27 Therefore, in this ANN architecture (Fig.1), a total of three input variables, a single hidden layer containing ten neurons and one output neuron were employed.
The input attributes were oyster mushroom thickness, drying temperature, and drying time, whereas final moisture content after drying was the output variable. The dataset was allocated into three subsets with 70, 15 and 15 per cent used for training, validation and testing, respectively. The training dataset was employed to analyse the relationship between the network’s input and output parameters.
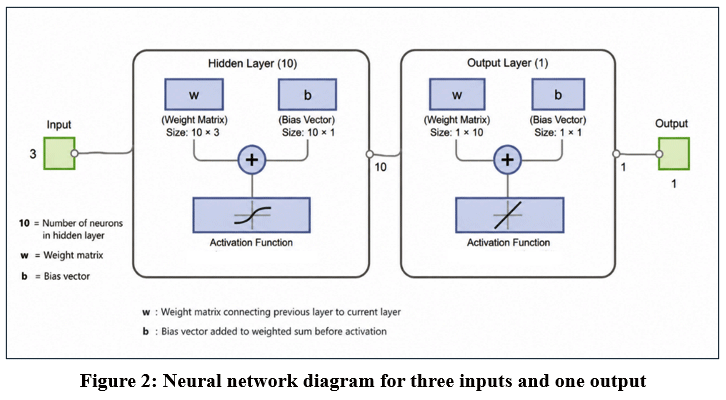 |
Figure 2: Neural network diagram for three inputs and one output |
Adaptive Neuro-fuzzy inference system (ANFIS)
The ANFIS analysis was done to determine the predicted value of moisture content using the Neuro-Fuzzy Logic Toolbox in MATLAB R2023b. A Sugeno-type fuzzy inference system (FIS) was constructed using grid partitioning, with the membership functions for all input variables defined by the ‘trimf’ (triangular membership) function. Each input was given three membership functions. To obtain the best-trained model for 30 epochs, a hybrid learning algorithm was applied as the optimum method to the fuzzy inference system. The capturing of drying parameters was done by automatically generated rules to cover twenty-seven IF–THEN combinations of fuzzy rules.28 ANFIS model was described with three drying parameter inputs (mushroom layer thickness ‘t’, drying time ‘DTime’, and drying temperature ‘DTemp’) and one output, ‘f’ (wet basis moisture content MC). The variable ‘f’ represents either the moisture ratio (MR) or drying rate (DR). It was explained as follows [3]:
Rule 1: If t is A1 and DTime is B1 and DTemp is C1 then f1

Rule 2: If t is A2 and DTime is B2 and DTemp is C2 then f2

Here, t represents the mushroom thickness in mm, DTemp is the input air temperature (C), DTime refers to the drying time (hr). The A₁, A₂, B₁, B₂, C₁, and C₂ denote the linguistic indicators. The parameters x₁, x₂, y₁, y₂, z₁, and z₂ are the linear coefficients of the output functions, whereas f₁ and f₂ represent first-order polynomial functions.
The ANFIS model, designed to anticipate the moisture content (w. b.) of mushrooms based on thickness (t), drying time (Dtime), and drying temperature (Dtemp), operates through a five-layer architecture that integrates fuzzy logic and neural network principles, optimised by a hybrid learning method combining backpropagation and least squares estimation. Each of the three input variables was defined with three triangular membership functions (trimf), covering the ranges of 5 to 20 mm for thickness, 6 to 10 hours for drying time, and 50°C to 70°C for drying temperature. ANFIS was included due to its hybrid structure, combining the nonlinear learning capability of ANN with the interpretability of fuzzy logic. Unlike RSM, it does not rely on predefined equations, and unlike ANN, it provides rule-based insights, making it particularly suitable for modelling the complex and uncertain behaviour of mushroom drying.
Layer 1 serves as the fuzzification layer, where the input variables were mapped to fuzzy sets using the defined membership functions. This results in a total of 27 fuzzy rules generated by grid partitioning, each representing a unique combination of the linguistic terms (e.g., A1 for low thickness, B2 for medium drying time, etc.). Membership values for each adaptive node were written as follows:29,30
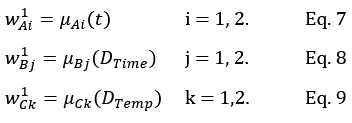
In Layer 2, the firing strength of each rule is computed by applying the fuzzy AND operator (typically the product of membership degrees) across the inputs. The firing strength of each rule is calculated by multiplying the membership values of all the input variables involved in that rule.

Layer 3 normalises these firing strengths to ensure they are proportionally scaled. Each rule’s firing strength is divided by the total of all firing strengths. This ensures that the weights used in the final output calculation are proportional and sum up to 1.24

In the fourth layer (Defuzzification), each node in this layer represents the output function of a fuzzy rule. ANFIS uses a first-order Sugeno-type fuzzy inference, where the output of each rule is a linear equation:

The fifth layer aggregates all the weighted outputs from Layer 4 to produce a single crisp output, i.e. the predicted moisture content (MC).30,31

In this present study, the same dataset of 100 observations used in the ANN block was applied to the ANFIS model. The data set for network modelling was divided randomly divided into three groups: 70% for training and 15% each for testing and validation.
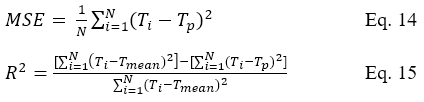
The errors between the model’s target and output values were evaluated using statistical parameters, R2 and mean square error (MSE):32,33
Results
Drying kinetics
As shown in Figure 3, the moisture ratio with drying time demonstrated an initially steep decline, which gradually became more gradual as drying proceeded and equilibrium moisture content was reached. This behaviour is attributable to the high initial moisture level in the mushroom samples, necessitating rapid moisture removal at the start of the process. The drying curve fitting at three different temperatures was done by using the MATLAB curve fitting tool. The performance of the different drying models was assessed using the correlation coefficient (R2), sum of squared error (SSE), and root mean square error (RMSE). The highest R2 and the lowest SSE and RMSE were considered the best-fitting model.34,35 The best goodness of fit model f(x) = a*exp (-((x-b)/c) ^2) from Table 1 was observed for 70°C, 60°C and 50°C temperature drying with highest R-square (0.9982, 0.9936, 0.9969), lowest SSE (0.0025, 0.0098, 0.0052) and lowest RMSE (0.0144, 0.0256, 0.0171).
Table 1: shows the data for different models
|
Drying Temperature |
Model |
Co-efficient |
Parameter |
||||
|
a |
b |
c |
R-square |
SSE |
RMSE |
||
|
70 ° |
f(x) = a*x^2 + b*x + c |
0.0345 |
-0.3993 |
1.1341 |
0.9863 |
0.0190 |
0.0398 |
|
f(x) = a*exp(b*x) |
1.4129 |
-0.6213 |
|
0.9929 |
0.0098 |
0.0275 |
|
|
f(x) = a*log(x) + b |
-0.3951 |
0.7112 |
|
0.9628 |
0.0516 |
0.0630 |
|
|
f(x) = a*exp (-((x-b)/c) ^2) |
2.3208 |
-3.1594 |
3.9869 |
0.9982 |
0.0025 |
0.0144 |
|
|
60 ° |
f(x) = a*x^2 + b*x + c |
0.0268 |
-0.3438 |
1.0424 |
0.9370 |
0.0960 |
0.0800 |
|
f(x) = a*exp(b*x) |
1.4946 |
-0.7036 |
|
0.9898 |
0.0156 |
0.0312 |
|
|
f(x) = a*log(x) + b |
-0.3558 |
0.6672 |
|
0.9084 |
0.1395 |
0.0934 |
|
|
f(x) = a*exp (-((x-b)/c) ^2) |
2.6533 |
-3.0486 |
3.6322 |
0.9936 |
0.0098 |
0.0256 |
|
|
50 ° |
f(x) = a*x^2 + b*x + c |
0.0155 |
-0.2537 |
1.0457 |
0.9878 |
0.0207 |
0.0339 |
|
f(x) = a*exp(b*x) |
1.2383 |
-0.4005 |
|
0.9958 |
0.0072 |
0.0195 |
|
|
f(x) = a*log(x) + b |
-0.3529 |
0.7775 |
|
0.9767 |
0.0398 |
0.0457 |
|
|
f(x) = a*exp (-((x-b)/c) ^2) |
21.6248 |
-16.7880 |
9.8515 |
0.9969 |
0.0052 |
0.0171 |
|
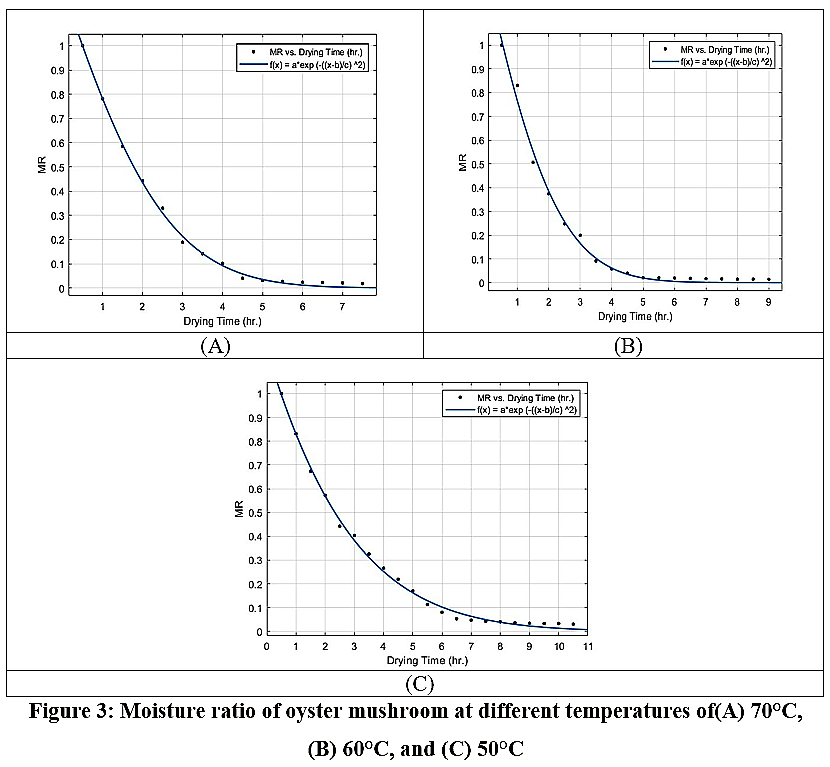 |
Figure 3: Moisture ratio of oyster mushroom at different temperatures of(A) 70°C, (B) 60°C, and (C) 50°C |
RSM modelling
The moisture contents of mushrooms after drying were given in Table 2. The drying time and temperature exerted a significant influence on the response variable. The lowest wet basis moisture content, 6.78%, was observed at a drying temperature of 70°C and a drying time of 10 hours, with a mushroom thickness of 8 mm.
Table 2: Experimental value of moisture content
|
Run |
Factors |
Response |
||
|
A: Thickness |
B: Time |
C: Temperature |
MC (wet basis) |
|
|
mm |
Hr. |
Degree |
% |
|
|
1 |
8.00 |
10 |
50 |
16.01 |
|
2 |
13.00 |
8 |
60 |
19.11 |
|
3 |
8.00 |
6 |
70 |
14.33 |
|
4 |
13.00 |
4.6 |
60 |
38.66 |
|
5 |
13.00 |
8 |
60 |
19.56 |
|
6 |
18.00 |
10 |
50 |
18.58 |
|
7 |
18.00 |
6 |
70 |
18.91 |
|
8 |
8.00 |
10 |
70 |
6.78 |
|
9 |
21.41 |
8 |
60 |
29.39 |
|
10 |
13.00 |
8 |
60 |
22.08 |
|
11 |
18.00 |
6 |
50 |
32.33 |
|
12 |
13.00 |
8 |
76.81 |
11.56 |
|
13 |
13.00 |
8 |
60 |
20.56 |
|
14 |
4.59 |
8 |
60 |
11.23 |
|
15 |
8.00 |
6 |
50 |
26.33 |
|
16 |
13.00 |
8 |
60 |
19.86 |
|
17 |
13.00 |
8 |
43.18 |
38.36 |
|
18 |
13.00 |
11.36 |
60 |
10.12 |
|
19 |
18.00 |
10 |
70 |
11.61 |
|
20 |
13.00 |
8 |
60 |
17.84 |
ANOVA for Linear model
ANOVA results could be employed for analysis and validation in different models.36,37 The analysis was configured with the natural log of moisture content data, and Table 3 was generated. The highest correlation coefficient 0.906 and standard deviation 0.151 were observed with the linear model for the drying process.
In Equation (16) represents the drying process with the input factors.

The predicted moisture content data from RSM were presented in Figure 3
Table 3: ANOVA analysis of experimental data
|
Source |
Sum of Squares |
Mean Square |
F-value |
p-value |
|
|
Model |
3.560 |
1.190 |
51.810 |
< 0.0001 |
significant |
|
A-Thickness |
0.568 |
0.568 |
24.870 |
0.0001 |
|
|
B-Time |
1.510 |
1.510 |
66.020 |
< 0.0001 |
|
|
C-Temperature |
1.480 |
1.480 |
64.560 |
< 0.0001 |
|
|
Residual |
0.366 |
0.022 |
|||
|
Lack of Fit |
0.340 |
0.031 |
6.050 |
0.029 |
significant |
|
Pure Error |
0.025 |
0.005 |
|||
|
Cor Total |
3.920 |
3D Surface Plotting
Figure 4 was used to express the interaction among thickness, drying time and temperature with moisture content received from RSM. The contour plots were created by varying two input parameters across their respective experimental range while holding the other factors constant at their baseline levels. Figure 4, (A) and (B) show that increasing drying temperature and time reduced moisture content. Similarly, in (C) and (D), decreasing thickness while increasing drying time lowered moisture content. In (E) and (F), increasing thickness and lowering drying temperature led to higher moisture content.
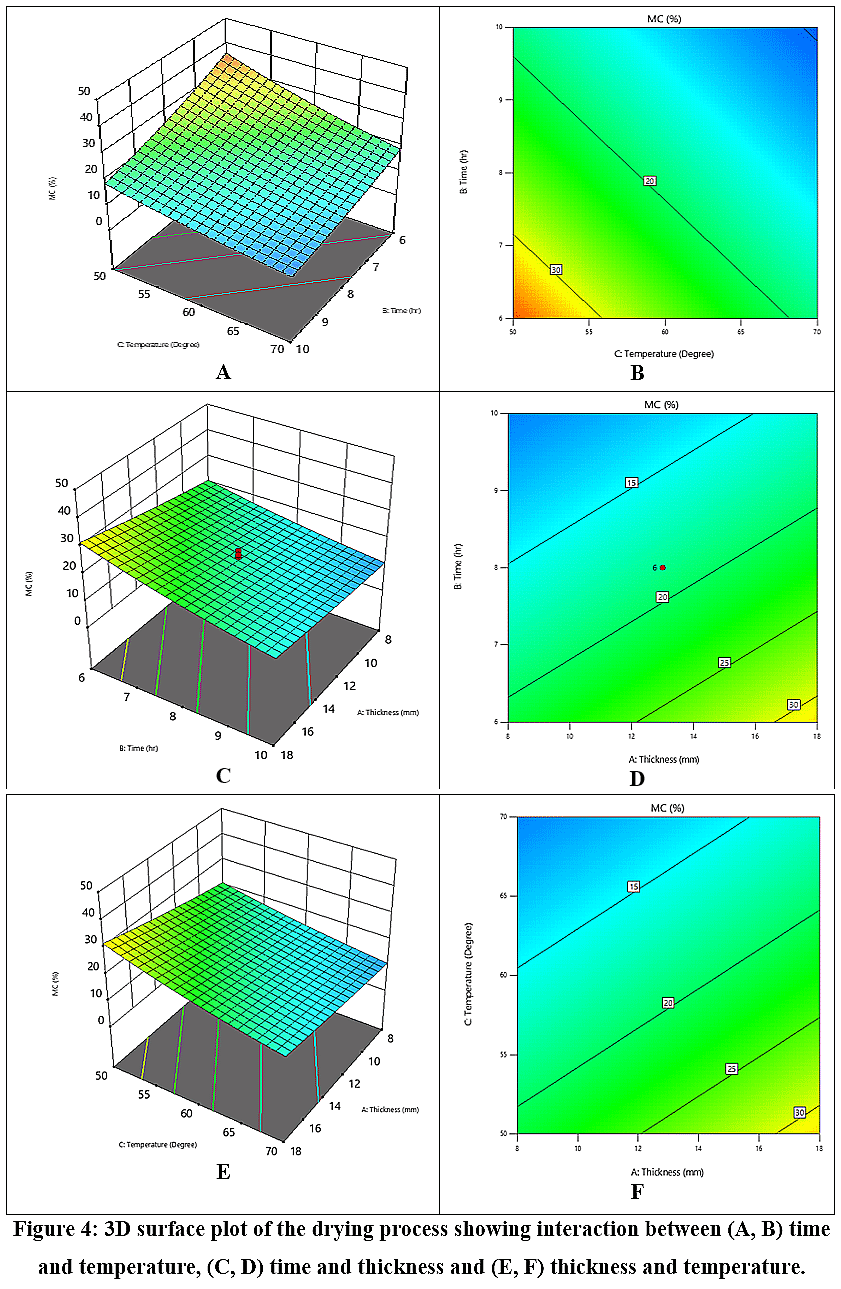 |
Figure 4: 3D surface plot of the drying process showing interaction between (A, B) time and temperature, (C, D) time and thickness and (E, F) thickness and temperature. |
ANN modelling
The relationship between the number of neurons, mean square error, and performance validation was illustrated using an ANN regression plot. A trial-and-error approach was used to determine the optimal number of neurons in the hidden layer, aiming to minimise deviations between experimental and predicted values.38,39 The multilayer perceptron consisted of three input nodes representing temperature, time, and thickness, a single hidden layer with ten neurons selected through trial optimisation, and one output node for predicted moisture content.
The weighted combination of inputs received by each neuron was transformed using a nonlinear activation function to generate the corresponding output signal.39 The optimal ANN architecture for prediction was structured as 3–10–1. The targeted training cycle was for 1000 epochs. The network showed its best validation performance at the 8th epoch iteration with a minimum MSE value of 0.640 (Figure 5). The training stopped due to the gradient becoming very small (3.59e-10 < 1e-07), indicating convergence without overfitting.
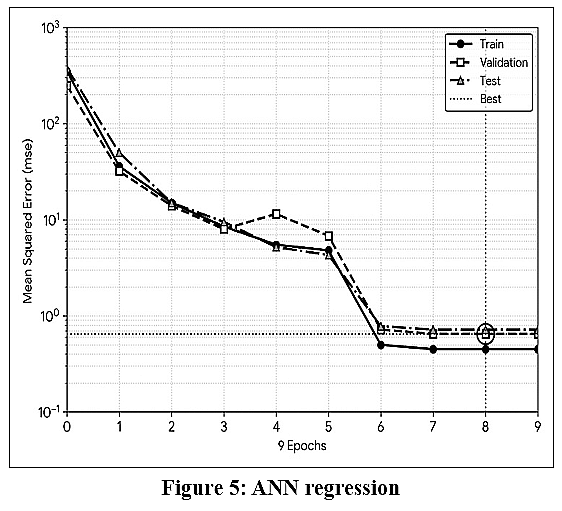 |
Figure 5: ANN regression |
Mean squared error (MSE) values of 0.435, 0.640 and 0.708 were found in the training, validation and testing phases, respectively. The corresponding regression values were 0.997, 0.996 and 0.995, with an overall regression value of 0.996.
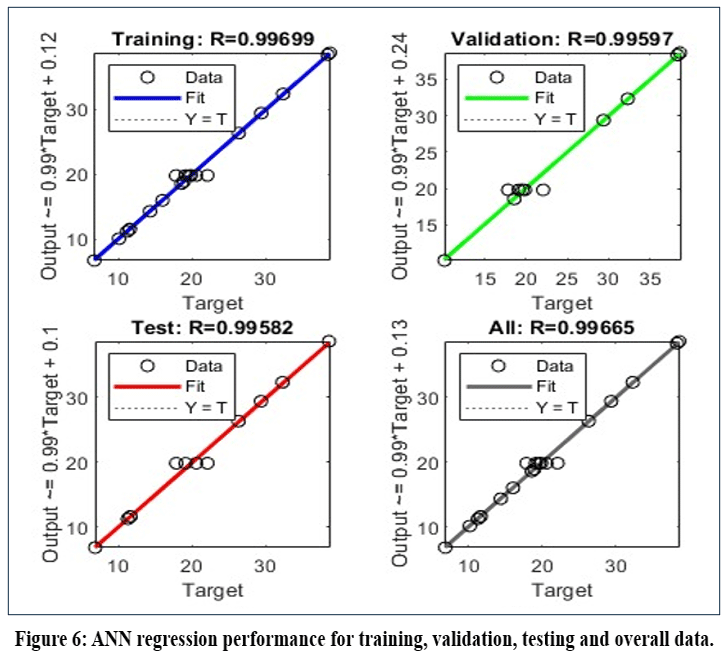 |
Figure 6: ANN regression performance for training, validation, testing and overall data. |
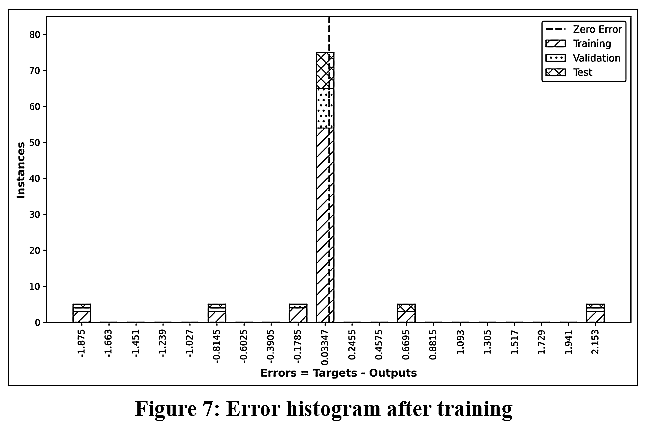 |
Figure 7: Error histogram after training |
The error histogram (Figure 7) of 20 bins provides a visual representation of the differences between the target values and the network’s predicted outputs, separated by training, validation, and test datasets.
ANFIS modelling
The same 100 observations used for ANN modelling were used for developing the ANFIS model. The dataset was arranged in a 100 × 4 matrix using a MATLAB m-file. The matrix included three input variables, namely mushroom thickness, drying time, and drying temperature, along with moisture content as the output variable. The ‘Trimf’ membership function was selected for the grid partitioning process. The Sugeno FIS structure used is illustrated in Figure 8.
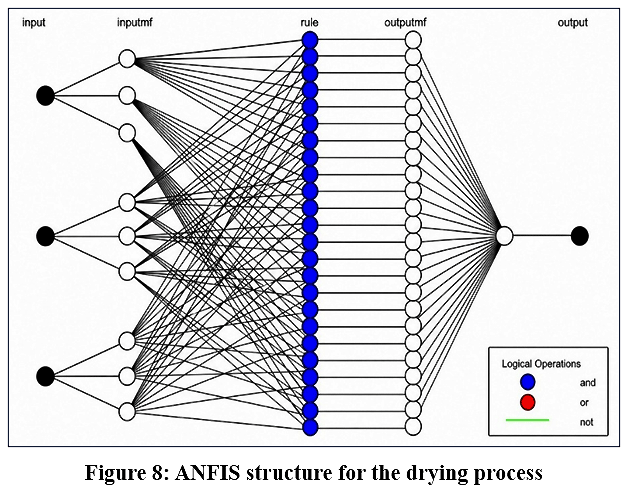 |
Figure 8: ANFIS structure for the drying process |
The MSE for the training, validation (checking) and testing subsets were 2.476, 2.619, and 0.689, respectively.
Model predictions and comparison
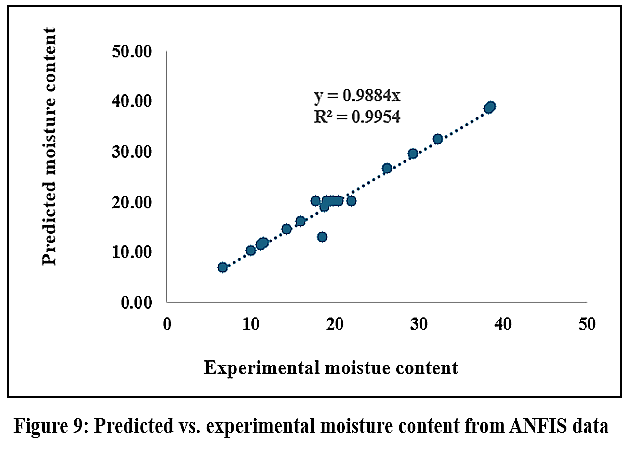 |
Figure 9: Predicted vs. experimental moisture content from ANFIS data |
The predicted moisture contents (wet basis) by the three different models from RSM, ANFIS and ANN for twenty data sets were compared with the experimental data. Table 4 presents the observed (experimental) values, the corresponding predicted values, and the calculated residuals (differences between observed and predicted values).
Table 4: Predicted moisture (wet basis) content and the residuals of RSM, ANFIS and ANN models
|
MC Experimental % |
Model Prediction |
Residuals |
||||
|
RSM |
ANFIS |
ANN |
RSM |
ANFIS |
ANN |
|
|
22.08 |
18.55 |
19.89 |
19.91 |
3.53 |
2.19 |
2.17 |
|
32.33 |
44.08 |
32.33 |
32.66 |
-11.75 |
0.00 |
-0.33 |
|
11.56 |
10.67 |
11.56 |
11.61 |
0.89 |
0.00 |
-0.05 |
|
20.56 |
18.55 |
19.89 |
19.91 |
2.01 |
0.67 |
0.65 |
|
11.23 |
13.16 |
11.23 |
11.03 |
-1.93 |
0.00 |
0.20 |
|
26.33 |
29.31 |
26.33 |
26.46 |
-2.98 |
0.00 |
-0.13 |
|
19.86 |
18.55 |
19.89 |
19.91 |
1.31 |
-0.03 |
-0.05 |
|
38.36 |
32.25 |
38.36 |
38.10 |
6.11 |
0.00 |
0.26 |
|
11.61 |
11.74 |
11.61 |
11.98 |
-0.13 |
0.00 |
-0.37 |
|
17.84 |
18.55 |
19.89 |
19.91 |
-0.71 |
-2.05 |
-2.07 |
|
16.01 |
15.07 |
16.01 |
16.14 |
0.94 |
0.00 |
-0.13 |
|
19.11 |
18.55 |
19.89 |
19.91 |
0.56 |
-0.78 |
-0.80 |
|
14.33 |
15.18 |
14.33 |
14.10 |
-0.85 |
0.00 |
0.23 |
|
38.66 |
32.45 |
38.66 |
38.66 |
6.21 |
0.00 |
0.00 |
|
19.56 |
18.55 |
19.89 |
19.91 |
1.01 |
-0.33 |
-0.35 |
|
18.58 |
22.67 |
12.72 |
18.58 |
-4.09 |
5.86 |
0.00 |
|
18.91 |
22.83 |
18.91 |
19.44 |
-3.92 |
0.00 |
-0.53 |
|
6.78 |
7.8 |
6.78 |
10.52 |
-1.02 |
0.00 |
-3.74 |
|
29.39 |
26.15 |
29.39 |
29.90 |
3.24 |
0.00 |
-0.51 |
|
10.12 |
10.6 |
10.12 |
10.48 |
-0.48 |
0.00 |
-0.36 |
Discussion
Drying kinetics
The higher drying temperatures resulted in a faster reduction in moisture ratio, indicating that increasing temperature leads to a shorter overall drying time. The degree of agreement between the experimental observations and the values estimated by each model was assessed using the correlation coefficient (R2), sum of squared error (SSE), and root mean square error (RMSE). The model exhibiting the highest R² together with the lowest SSE and RMSE was considered the most accurate and suitable model for describing the drying behaviour of the mushroom samples.34,35 In this case, A (thickness), B (time) and C (temperature) were all significant. The observations were consistent with previous studies on mushroom drying, where the absence of a constant-rate period has been attributed to the highly porous structure and rapid depletion of free surface moisture.40,41
RSM modelling and ANOVA
The Predicted R² of 0.838 closely aligned with the Adjusted R² of 0.888, and as the difference between these values is less than 0.2, indicating a goodness of fit for the model. The significance and magnitude of the model terms were determined using the p-value at a 95% confidence level along with the F-value. As shown in Table 3, P-values less than 0.0500 indicate that model terms were significant.42,43 The Model F-value of 51.81 implies that the linear model was significant for the experimental data. There was only a 0.01% chance that an F-value this large could occur due to noise. A coefficient of variation (CV) of 5.20 in the model indicates a high level of reliability and precision in the experimental data.
During the stepwise analysis of variance (ANOVA) reduction, all quadratic terms and cross-product interaction terms were found to be statistically insignificant ( 𝑝 >0.05). To make the model simple and avoid inflating the residual error, these insignificant high-order terms were systematically excluded, resulting in a simplified final linear regression model.
In response surface methodology, an insignificant lack-of-fit is generally desired for model validity.44 However, the significant lack-of-fit observed in this study (p = 0.0298) indicates that the model does not fully capture the underlying relationship between variables, suggesting the presence of higher-order or interaction effects.45 This insignificance strongly implies that the underlying physical relationship governing mushroom drying is highly complex and nonlinear. Consequently, the linear RSM model is insufficient for accurate process control of drying that directly justifies the transition toward advanced machine learning paradigms like ANN and ANFIS.
In the 3D surface and contour plots (Figure 4), the reduction in moisture content with increasing temperature and time resulted in a greater driving force for moisture diffusion. The higher the temperature, the higher will be the vapour pressure gradient between the sample and the drying air. The lower moisture content achieved with decreasing thickness and increasing time (C, D) was attributable to the shorter diffusion path length in thinner samples. The increase in the surface-area-to-volume ratio allowed the moisture to reach the surface and evaporate more readily. A longer moisture diffusion time and low vapour pressure gradient reflected the integrated effect of the higher sample thickness and low temperature (E, F). This subsequently reduced the rate of drying. The drying temperature and time had a greater effect on moisture reduction than thickness, as also indicated by the higher F-values for B and C than A.
ANN Modelling
The high regression values were observed for the training, validation and testing phases (0.997, 0.996 and 0.9958, respectively), together with the overall regression value of 0.9966, indicating a strong correlation between the predicted and experimental moisture content. It also confirmed that the network’s output closely followed the target values and demonstrated reliable model performance. The stopping of training was due to a very small gradient, indicating that the network converged without overfitting. Yet, a small gradient during convergence does not definitively rule out the total absence of overfitting. The concentration of prediction errors was close to zero in the error histogram, further indicating that most of the network’s predictions were very close to the actual values. In the error histogram, the majority of the errors were concentrated around zero, specifically in the range between approximately -0.09 and 0.09, indicating that most predictions were very close to the actual values.
ANFIS modelling
The low MSE values indicate that the ANFIS model performed well across all data subsets, showing no signs of overfitting. A strong level of correlation was observed between the experimental and predicted data with an overall correlation coefficient of 0.9953, suggesting that the model was capable of accurately predicting moisture content.
Conclusion
This study revealed the effectiveness of advanced modelling methods for predicting wet basis moisture content during drying of oyster mushrooms. The conventional statistical modelling through RSM provided satisfactory results, but its predictive capability was found to be limited compared to AI approaches. Both ANN and ANFIS captured the nonlinear relationships between drying parameters (temperature, time and thickness) and wet-basis moisture content with high accuracy, with ANN slightly outperforming ANFIS in terms of prediction error and correlation. The findings from this study highlighted the potential of ANN and ANFIS as reliable predictive tools for real-time monitoring and optimisation of drying processes. The integration of these data-driven models into commercial drying systems is necessary for evaluating processing efficiency, thermal energy consumption and improving product quality. Moreover, the AI models developed in the study can be used to design intelligent drying strategies, aiding in the large scale-drying of oyster mushrooms.
Acknowledgement
The authors sincerely acknowledge the Department of Agricultural Engineering, Assam Agricultural University, Jorhat, for providing the necessary infrastructure and research facilities to conduct this study. The authors are also thankful to the All India Coordinated Research Project (AICRP) on Post-Harvest Engineering and Technology (PHET) for their continuous technical support and guidance.
Funding Sources
The author(s) received no financial support for the research, authorship, and/or publication of this article.
Conflict of Interest
The author(s) do not have any conflict of interest.
Data availability Statement
Data will be made available on request.
Ethics Statement
This research did not involve human participants, animal subjects, or any material that requires ethical approval.
Informed Consent Statement
This study did not involve human participants, and therefore, informed consent was not required.
Clinical Trial Registration
This research does not involve any clinical trials.
Permission to reproduce material from other sources
Not Applicable
Author Contributions
- Kaushik Hazarika: Conceptualization, Methodology, Formal analysis, Data curation, Writing – original draft – review & editing.
- Abhijit Borah: Resources, Data curation, Supervision.
- Rejaul Hoque Bepary: Writing – original draft, review & editing.
- Tabaruk Hussain: Methodology, Writing – original draft, Writing.
- Saurajyoti Baishya: Supervision, review & editing.
References
- Sałata A, Lemieszek M, Parzymies M. THE NUTRITIONAL AND HEALTH PROPERTIES OF AN OYSTER MUSHROOM (Pleurotus ostreatus (Jacq. Fr) P. Kumm.). Acta Scientiarum Polonorum Hortorum Cultus. 2018;17(2):185-197. doi:10.24326/asphc.2018.2.16
CrossRef - Thakur MP. Advances in mushroom production: key to food, nutritional and employment security: A review. Indian Phytopathol. 2020;73(3):377-395. doi:10.1007/s42360-020-00244-9
CrossRef - C. Madusanka, D. Udayanga, Dimuthu S. Manamgoda. Sustainable Bioeconomy Approaches to Edible Mushroom Cultivation in Sri Lanka: Environmental and Economic Benefits. In: Mapa Sumudu, ed. Sustainable Bioeconomy Approaches to Strengthen Economy, Society and the Environment in Sri Lanka. 2025:237-252.
- Royse DJ, Baars J, Tan Q. Current Overview of Mushroom Production in the World. In: Edible and Medicinal Mushrooms. Wiley; 2017:5-13. doi:10.1002/9781119149446.ch2
CrossRef - The State of Food and Agriculture 2021. FAO; 2021. doi:10.4060/cb4476en
CrossRef - Assemie A, Abaya G. The Effect of Edible Mushroom on Health and Their Biochemistry. Int J Microbiol. 2022;2022:1-7. doi:10.1155/2022/8744788
CrossRef - Castellanos-Reyes K, Villalobos-Carvajal R, Beldarrain-Iznaga T. Fresh Mushroom Preservation Techniques. Foods. 2021;10(9):2126. doi:10.3390/foods10092126
CrossRef - SÜFER Ö, SEZER YÇ, BOZOK F. Convective and Microwave Drying of Mushrooms (A.bisporus and P.ostreatus). Indian Journal of Pharmaceutical Education and Research. 2017;51(3s2):s389-s392. doi:10.5530/ijper.51.3s.54
CrossRef - Zielinska M, Markowski M. Air drying characteristics and moisture diffusivity of carrots. Chemical Engineering and Processing: Process Intensification. 2010;49(2):212-218. doi:10.1016/j.cep.2009.12.005
CrossRef - Madamba PS, Driscoll RH, Buckle KA. The thin-layer drying characteristics of garlic slices. J Food Eng. 1996;29(1):75-97. doi:10.1016/0260-8774(95)00062-3
CrossRef - Omari A, Behroozi‐Khazaei N, Sharifian F. Drying kinetic and artificial neural network modeling of mushroom drying process in microwave‐hot air dryer. J Food Process Eng. 2018;41(7). doi:10.1111/jfpe.12849
CrossRef - Midilli A, Kucuk H, Yapar Z. A NEW MODEL FOR SINGLE-LAYER DRYING. Drying Technology. 2002;20(7):1503-1513. doi:10.1081/DRT-120005864
CrossRef - Shukla R, Kumar P, Vishwakarma DK, Ali R, Kumar R, Kuriqi A. Modeling of stage-discharge using back propagation ANN-, ANFIS-, and WANN-based computing techniques. Theor Appl Climatol. 2022;147(3-4):867-889. doi:10.1007/s00704-021-03863-y
CrossRef - Amini G, Salehi F, Rasouli M. Drying kinetics of basil seed mucilage in an infrared dryer: Application of GA‐ANN and ANFIS for the prediction of drying time and moisture ratio. J Food Process Preserv. 2021;45(3). doi:10.1111/jfpp.15258
CrossRef - Bousselma A, Abdessemed D, Tahraoui H, Amrane A, Artificial AA. Intelligence and Mathematical Modelling of the Drying Kinetics of Pre-treated Whole Apricots. Kemija u industriji. 2021:11-12. doi:10.15255/KUI.2020.079ï
CrossRef - Ait Hmazi F, Bagar H, Madani A, Mrani I. A novel approach for modelling and predicting the drying kinetics of couscous grains using artificial neural networks. Journal of Food Composition and Analysis. 2024;132. doi:10.1016/j.jfca.2024.106301
CrossRef - Tarafdar A, Shahi NC, Singh A. Freeze-drying behaviour prediction of button mushrooms using artificial neural network and comparison with semi-empirical models. Neural Comput Appl. 2019;31(11):7257-7268. doi:10.1007/s00521-018-3567-1
CrossRef - Karimi Motlagh M, Beheshti B, Borghei AM, Gholami Parashkoohi M. Mathematical models and ANFIS for determination of diffusivity and activation energy of button mushroom thin layer drying. Emir J Food Agric. 2025;37:1-12. doi:10.3897/ejfa.2025.126332
CrossRef - Buluș HN, Moralar A, Çelen S. Modeling the Moisture Content and Drying Rate of Zucchini (Cucurbita Pepo L.) in a Solar Hybrid Dryer Using ANN and ANFIS Methods. https://www.ukdr.uplb.edu.ph/pas/vol106/iss3/6
- Kushwah A, Gaur MK, Kumar A, Singh P. Application of ANN and prediction of drying behavior of mushroom drying in side hybrid greenhouse solar dryer: An experimental validation. Journal of Thermal Engineering. 2022;8(2):221-234. doi:10.18186/THERMAL.1086189
CrossRef - Peter M, Liu Z, Fang Y, et al. Computational intelligence and mathematical modelling in chanterelle mushrooms’ drying process under heat pump dryer. Biosyst Eng. 2021;212:143-159. doi:10.1016/j.biosystemseng.2021.10.002
CrossRef - Nadew TT, Reshad AS, Tedla TS. Oyster mushroom drying in tray dryer: Parameter optimization using response surface methodology, drying kinetics, and characterization. Heliyon. 2024;10(2). doi:10.1016/j.heliyon.2024.e24623
CrossRef - Sharma R, Nath PC, Seth D. Optimization of spray-drying conditions using response surface methodology, physico-chemical characterization and shelf-life estimation of pineapple powder. Sustainable Food Technology. 2023;1(5):750-761. doi:10.1039/d3fb00008g
CrossRef - Aghaeinejad-Meybodi A, Ebadi A, Shafiei S, Khataee AR, Rostampour M. Modeling and optimization of antidepressant drug Fluoxetine removal in aqueous media by ozone/H2O2 process: Comparison of central composite design and artificial neural network approaches. J Taiwan Inst Chem Eng. 2015;48:40-48. doi:10.1016/j.jtice.2014.10.022
CrossRef - Taheri-Garavand A, Karimi F, Karimi M, Lotfi V, Khoobbakht G. Hybrid response surface methodology–artificial neural network optimization of drying process of banana slices in a forced convective dryer. Food Science and Technology International. 2018;24(4):277-291. doi:10.1177/1082013217747712
CrossRef - Onu CE, Igbokwe PK, Nwabanne JT, Ohale PE. ANFIS, ANN, and RSM modeling of moisture content reduction of cocoyam slices. J Food Process Preserv. 2022;46(1). doi:10.1111/jfpp.16032
CrossRef - Fan M, Li T, Hu J, et al. Artificial neural network modeling and genetic algorithm optimization for cadmium removal from aqueous solutions by reduced graphene oxide-supported nanoscale zero-valent iron (nZVI/rGO) composites. Materials. 2017;10(5). doi:10.3390/ma10050544
CrossRef - Golpour I, Kaveh M, Amiri Chayjan R, Guiné RPF. Optimization of Infrared-convective Drying of White Mulberry Fruit Using Response Surface Methodology and Development of a Predictive Model through Artificial Neural Network. International Journal of Fruit Science. 2020;20(sup2):S1015-S1035. doi:10.1080/15538362.2020.1774474
CrossRef - Pusat S, Akkoyunlu MT, Pekel E, Akkoyunlu MC, Özkan C, Kara SS. Estimation of coal moisture content in convective drying process using ANFIS. Fuel Processing Technology. 2016;147:12-17. doi:10.1016/j.fuproc.2015.12.010
CrossRef - Kaveh M, Rasooli Sharabiani V, Amiri Chayjan R, Taghinezhad E, Abbaspour-Gilandeh Y, Golpour I. ANFIS and ANNs model for prediction of moisture diffusivity and specific energy consumption potato, garlic and cantaloupe drying under convective hot air dryer. Information Processing in Agriculture. 2018;5(3):372-387. doi:10.1016/j.inpa.2018.05.003
CrossRef - Khoshnevisan B, Rafiee S, Omid M, Mousazadeh H. Development of an intelligent system based on ANFIS for predicting wheat grain yield on the basis of energy inputs. Information Processing in Agriculture. 2014;1(1):14-22. doi:10.1016/j.inpa.2014.04.001
CrossRef - Taki M, Abdanan Mehdizadeh S, Rohani A, Rahnama M, Rahmati-Joneidabad M. Applied machine learning in greenhouse simulation; new application and analysis. Information Processing in Agriculture. 2018;5(2):253-268. doi:10.1016/j.inpa.2018.01.003
CrossRef - Bilir T, Gencel O, Topcu IB. Prediction of restrained shrinkage crack widths of slag mortar composites by Takagi and Sugeno ANFIS models. Neural Comput Appl. 2016;27(8):2523-2536. doi:10.1007/s00521-015-2022-9
CrossRef - Tran TNT, Khoo KS, Chew KW, et al. Modelling drying kinetic of oyster mushroom dehydration – The optimization of drying conditions for dehydratation of Pleurotus species. Mater Sci Energy Technol. 2020;3:840-845. doi:10.1016/j.mset.2020.10.005
CrossRef - Tulek Y. Drying Kinetics of Oyster Mushroom (Pleurotus Ostreatus) in a Convective Hot Air Dryer. https://www.researchgate.net/publication/267945964
- Jin Y, Yin J, Xie H, Zhang Z. Investigation of a Precise Control Scheme for Rice Quality. Applied Sciences (Switzerland). 2023;13(13). doi:10.3390/app13137532
CrossRef - Amadi BC, Igbokwe PK, Onu CE. Enzymatic Hydrolysis of Blend of Lignicellulosic Materials for Reducing Sugar Production: Screening of Significant Process Factors. Asian Journal of Chemical Sciences. Published online October 21, 2020:1-10. doi:10.9734/ajocs/2020/v8i419048
CrossRef - Aydinalp-Koksal M, Ugursal VI. Comparison of neural network, conditional demand analysis, and engineering approaches for modeling end-use energy consumption in the residential sector. Appl Energy. 2008;85(4):271-296. doi:10.1016/j.apenergy.2006.09.012
CrossRef - Ohale PE, Uzoh CF, Onukwuli OD. Optimal factor evaluation for the dissolution of alumina from Azaraegbelu clay in acid solution using RSM and ANN comparative analysis. S Afr J Chem Eng. 2017;24:43-54. doi:10.1016/j.sajce.2017.06.003
CrossRef - Zielinska M, Markowski M. Air drying characteristics and moisture diffusivity of carrots. Chemical Engineering and Processing: Process Intensification. 2010;49(2):212-218. doi:10.1016/j.cep.2009.12.005
CrossRef - Addo A, Bart-Plange A, Boakye DM. Addo et al Characteristics of Cap and Stem of Mushroom DRYING CHARACTERISTICS OF CAP AND STEM OF MUSHROOM.
- Oguanobi Nonso Collins, Onu Chijioke Elijah, Onukwuli Okechukwu D. ADSORPTION OF A DYE (CRYSTAL VIOLET) ON AN ACID MODIFIED NON-CONVENTIONAL ADSORBENT. Journal of Chemical Technology and Metallurgy. 2019;54(1):95-110.
- Kim HK, Kim JG, Cho JD, Hong JW. Optimization and characterization of UV-curable adhesives for optical communications by response surface methodology. Polym Test. 2003;22(8):899-906. doi:10.1016/S0142-9418(03)00038-2
CrossRef - Rheem S. Optimizing Food Processing through a New Approach to Response Surface Methodology. Food Sci Anim Resour. 2023;43(2):374-381. doi:10.5851/kosfa.2023.e7
CrossRef - Goos P, Steven G. Testing for lack of fit in blocked, split-plot, and other multi-stratum designs. Journal of Quality Technology. 2017;49(4):320-336. doi:10.1080/00224065.2017.11918000
CrossRef