

Introduction
The life of farmers is not easy, farmers have to do very hard work throughout the year but the efforts and time of farmers is most times devastated by the diseases which also leads to the financial loss of farmers. The disease detection system contains an automatic process to detect leaf illnesses, and smartphone users can access information about leaf diseases 25. The disease detection system is capable of accurately detecting disease types. The disease detection system will be very useful for farmers to reduce the harm caused by the disease in the initial stage of disease occurrence. Disease control and its management is described by the factors like surveys, monitoring, classification and identification. In order to make an accurate diagnosis of the disease, the first and most important step is to set up an appropriate leaf detection system. The crop yields can be increased with the utilization of precision agriculture. There are always variations in crop yields due to a number of factors like changes in climate conditions, type of fertilizer used and soil characteristics. Utilization of automation in the agricultural field will help to increase the production of good quality crop yields while reducing the resources utilizations. The precision in Smart agriculture is improving by implementation of deep learning algorithms.
A lot of research has been done on what role ANN can play in the emerging field of smart irrigation water management, and how to implement it. Crop irrigation relies heavily on accurate estimates of reference evapotranspiration (ETo) for a variety of reasons, including but not limited to irrigation scheduling, precision farming, healthcare, etc. Agriculture management has changed a lot thanks to the Internet of Things 5. IoT technology connects all agricultural devices and gives real-time information that helps farmers make good decisions about irrigation and fertilizer application. Through wireless sensor networks, a variety of sensors can communicate and exchange data. The Internet of Things (IoT) works with cloud services to process and analyse the data from different sensors and make the best decisions in agriculture to increase crop yield 2,3,4. Many developing nations lose between 30 and 50 percent of their annual agricultural yield due to disease because of the lack of available control measures. It is possible that there won’t be enough food to eat if pests and fungi destroy crops. But in other years, the losses are much worse, causing disaster for those who depend on the crop for food. Diseases that spread quickly through food crops have been the cause of famines and large-scale migrations throughout history. Diseases are currently detected using a visual recognition method, but this is a laborious and time-consuming process with unsatisfactory results. The environment in which grapes grow would be negatively impacted, as would the quality of the resulting fruit if this technique were used excessively. Many different spectroscopy methods have been used for plant disease monitoring and detection, but the high cost and low efficiency that come with using highly sensitive sensors and complicated instruments limit their usefulness.
Overview of related work
CNN architectures have been heavily researched and implemented in the field of plant leaf diseases. Rendering to those work and studies, CNN gets the innovative, strong feature of diseased images right from the original images instead of manually extracting or selecting the features, which is better than the traditional methods of extracting features. But while using CNN, we have two main problems. One problem is that it takes a lot of data to train the models, and each disease on a grape leaf shows up at different times. This means that the time available for collecting images of the diseases is limited, which means that there are fewer grape images available for training the models. The second one is the hard job of classifying fine-grained images of grape leaf disease. The trained models with transfer learning did not have satisfactory achievements. Due to this design of an excellent CNN Structure for disease identification of grapes images is a formidable task. 4. In the past decades, due to advancements in 3G or 4G and NB-IoT technology, the speed at which exchange of information and communication has increased 24. This has led to an increase in the sharing of real-time data through IoT, which in turn has led to more accurate evaluations in the agricultural sector. On the other hand, the efficiency of data transmission is significantly reduced when it comes to 4G networks because of improvements in the quality of the data. 5.
An image classification system based on tomato leaf images is proposed in this study. When compared to machine learning, deep learning performs better in several key areas, including the accuracy of its categorizations and the breadth of its potential uses around the world. This paper makes a comparison between the ResNet50 and Xception architectures Greater accuracy of 99% can be achieved using Xception Architecture in combination with the Adam optimizer and 0.0001-learning rate. 1. Otsu’s segmentation technique was used in conjunction with a decision tree in the study carried out by Sabrol et al. [7] to try and diagnose the disease that was present in tomato leaves. In this study, authors employ leaf phenotypic features such as shape, texture, and colour to learn about leaf diseases. Classification accuracy was 97.30% using the proposed method. Early blight as well as powdery mildew in tomato leaves were detected using Moth-Flame Optimization and MFO Rough Set by Hassanien et al.[8]. The proposed strategy is tested with the help of the GA and PSO rough set algorithms. The experimental findings show that the proposed method has better precision (85.7%), recall (86.0%), and F-score (85.7%) than the current method.
About three hundred and sixty leaf colour photos were divided into six classifications by Sabrol et al. [7, 9] five unhealthy and one healthy. Using standard image processing, RGB images were transformed to the CIE XYZ colour space model using the classifiers FIS, MLBPNN, and ANFIS (ANFIS). With an accuracy percentage of 87.20%, MLBPNN is the most accurate algorithm. Annabel et al. 10 experimented with random forest algorithm and found useful to classify tomato leaf diseases like bacterial spot, late blight, tomato mosaic virus, and healthy leaf images. With the same dataset, the algorithm’s 94.10% accuracy is the highest among those obtained by SVM (82.60%) and MDC (87.60%). The proposed classification method achieves 95% accuracy in experiments. Hlaing et al in their work 11 used quadratic support vector machine to identify and classify diseased tomato leafs in plant-village datasets with seven classes. Pre-processing fills regions, assigns channel values, removes noise, etc.
Basavaiah and Anthony 12 identified the four most common tomato leaf diseases viz., mosaic virus, septoria spot, yellow curl virus, and Bacterial spot by combining data from various sources… Local binary patterns, color histograms, haralick moments, and more have been found in leaf samples by researchers. The decision tree and random forest algorithms use extracted features to classify data. Random forest outperforms decision tree in detection accuracy by 94%. An effort was made by Rangarajan et al., 13 to use a pretrained deep learning architecture that included transfer learning concepts, in particular AlexNet and VGG16, to extract characteristics from photos of tomatoes and categorize them as either healthy or unhealthy. In terms of accuracy in classification, AlexNet and VGG16 score 97.49% and 97.23%, respectively.
Traditional image processing methods like the Scale Invariant Feature Transform (SIFT), the Grey Level Co-occurrence Matrix (GLCM), and the Speeded Up Robust Features (SURF) all contribute respectably to disease identification through leaf pictures 16. However, this approach uses fewer datasets and produces conclusions that are more robust theoretically. Recently, there has been an uptick in research and development 17 for Artificial Intelligence (AI) techniques that use computer vision to recognize and classify things. Using SqueezNet and AlexNet, Durmuş et al. 18 were able to identify the tomato disease using photos of infected leaves pulled from the plantvillage database. When compared to AlexNet’s 95.65% accuracy, SqueezNet’s results are slightly lower (94.30%).
Using leaf image-based GoogLeNet and AlexNet models, Brahimi et al. 19 conducted experimental research to identify tomato plant disease. The outcome demonstrates that Google Net outperforms Alex Net, which has an accuracy of 98.60%, with a performance of 99.18%.
In order to evaluate the deep CNN model’s efficacy in diagnosing tomato diseases, Suryawati et al. [20] conducted experiments. It was found that the VGGNet model, which has more layers, had the highest accuracy (95.24 percent) of all the models tested. GoogleNet, and AlexNet and baseline CNN models are also studied and compare with GoogleNet. Deep CNN modeling was used to create the embedded-based VegeCare tool to identify six tomato leaf diseases 21. In 22, Sardogan et al. put forward the idea that a deep CNN model that was based on learning vector quantization (LVQ) could be used to classify four distinct diseases that can affect tomatoes, besides a healthy class. The approach yields 86% accuracy.
As a matter of fact, the proposed method is able to obtain an 86% accuracy in classification. To better predict the disease status of ten different tomato varieties from the plantvillage dataset, For mobile devices, Elhassouny et al. [23] developed a MobileNet-based deep CNN model. To detect tomato illnesses with plantvillage datasets, Ma et al. [24] presented transfer learning, with impressive results: 97.29% and 97.49% recognition accuracies for VGG16 and AlexNet, respectively.
Methodology
This paper introduces a CNN-based tomato leaf disease recognition method. The ideal CNN structure for detecting tomato leaf disease is challenging to design. The method used in this paper is to detect tomato leaf disease using an improved CNN algorithm. In the proposed method, data from “plant village” is analyzed. Within this procedure, we considered 14240 files across 9 different categories using images sourced from the public domain website plant village. The data are divided into a training and validation set. After this data augmentation applied for producing a larger dataset by incorporating slightly modified versions of an existing dataset. We used the publically available dataset of 14240 image files to train a CNN model from scratch. Throughout the course of the training’s iterations, the model’s performance will shift, signaling the need for gradual, incremental adjustments to the model’s weights. For training purposes here, we used 20 epochs. To measure how well an algorithm performs, a comprehensible measure of accuracy is used. After the model’s parameters have been entered, the accuracy of the model is typically evaluated and displayed as a percentage. The precision of the model’s forecast is measured against the actual data. The trained model may be later saved to a disc for processing. All the work done in web based computing platform jupyter notebook.
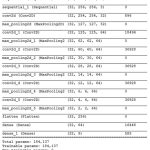 |
Figure 1: CNN Architecture summary. |
In this work, we used Keras Sequential API to construct a CNN model. Using the Sequential class, one can create an instance of a sequential model. Layers can be convolutional, pooling, or dense, among others. Sequential model Finally, we’ll use the summary method to get a snapshot of the full CNN architecture as mentioned in the figure 1, and take into account all of the parameters.
Convolution, Pooling, Flatten, and Classification are the typical layers in a CNN’s architecture.
In a CNN, the initial layer is a convolutional one. A CNN may consist of several convolutional layers. When images are fed into the first convolutional layer, processing can begin. The purpose of the convolutional layer is feature extraction while preserving local pixel context. CNNs also make use of a second type of layer called a pooling layer. In a CNN, the pooling layers can be nested. One pooling layer follows each convolutional layer. Therefore, layers of convolution and pooling are used in tandem with one another. The most salient characteristics are extracted by the pooling layer by maximizing or averaging the relevant numerical features.
Cut down on the number of pixels used in the output from previous convolutional layers, or the dimensionality. Reduce the amount of parameters that are used by the network. Remove any noise from previous convolutional layers’ extracted features.
CNNs use a Multilayer Perceptron to assign a class label to the pooled feature map produced by the final pooling layer. The last layers of a convolutional neural network (CNN) are fully connected (dense) layers. A previously flattened layer is the input. It’s possible for there to be more than one layer that shares connections with every other layer. Classification is performed by the last layer. In each fully connected layer, an activation function is applied. This layer is responsible for assigning a category label to the image features that have been detected.
Results and Discussion
Finding, understanding, and comparing data to make complicated ideas more easily communicated through visualization aids in-depth study and discovery of logical patterns. Many types of analytical work benefit greatly from the use of data visualization, such as data summaries, analysis of test results, and analysis of model outputs. Figure 2 represents random 15 images plotted to verify database.
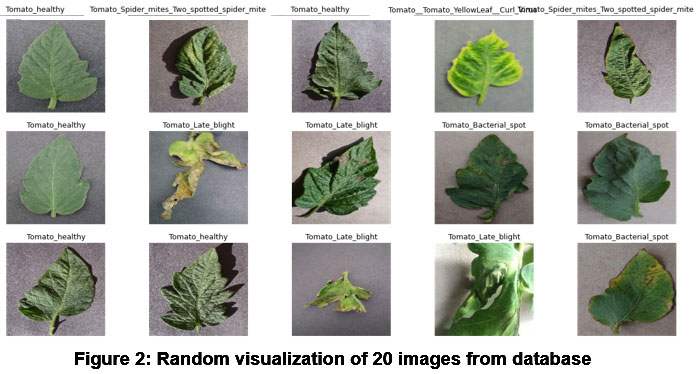 |
Figure 2: Random visualization of 20 images from database |
We have trained our model on tomato plant leaf diseases using custom Convolutional Neural Network to classify the diseases. We have trained the Plant village data set of 9 classes. The code snippet in the figure 3 represent the 8 classes of tomato leaf disease and ninth class is healthy leaf.
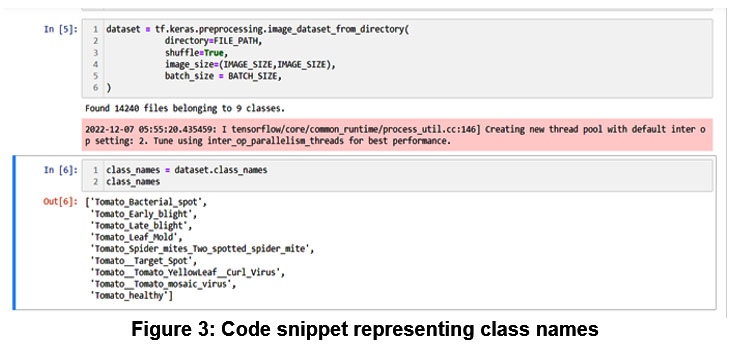 |
Figure 3: Code snippet representing class names |
It is necessary to perform image preprocessing prior to using the data for model training. Size, rotation, and zoom are just some of the many alterations that may be made. We can perform more accurate analysis if the image quality is improved through pre-processing. As a result, we split the data we use to train with into three categories: train (80%), and validate (20%).
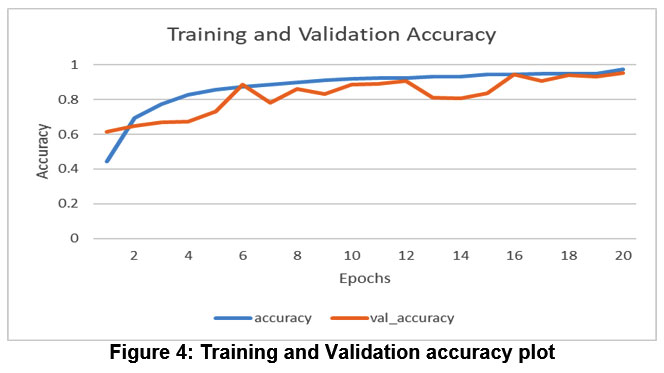 |
Figure 4: Training and Validation accuracy plot |
The model’s performance is increasing with time, indicating that it is gaining knowledge through experience (learning). Figure 4 also shows that it expands initially, but eventually reaches a plateau, suggesting it can no longer learn. Figure 4 displays a plot of accuracy across 20 epochs, indicating that the accuracy reached 95.53% after the 20th epoch when applied to both the training dataset and the validation dataset.
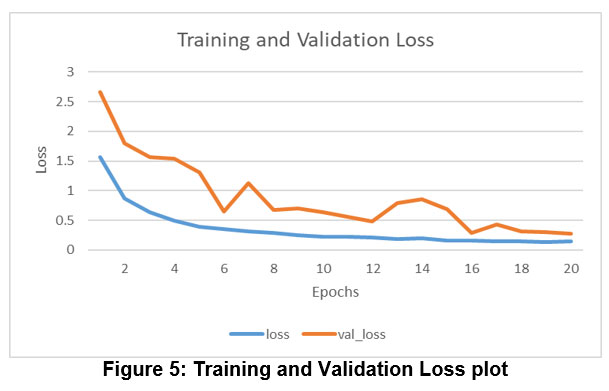 |
Figure 5: Training and Validation Loss plot |
Training loss shows how well the model fits training data, while validation loss shows how well it fits new data. Figure 5 depicts training and validation loss.
If you take a look at figure 6 and compare the real labels to the ones our model has assigned, you’ll see that it makes accurate classifications. Every predicted image also has a confidence score.
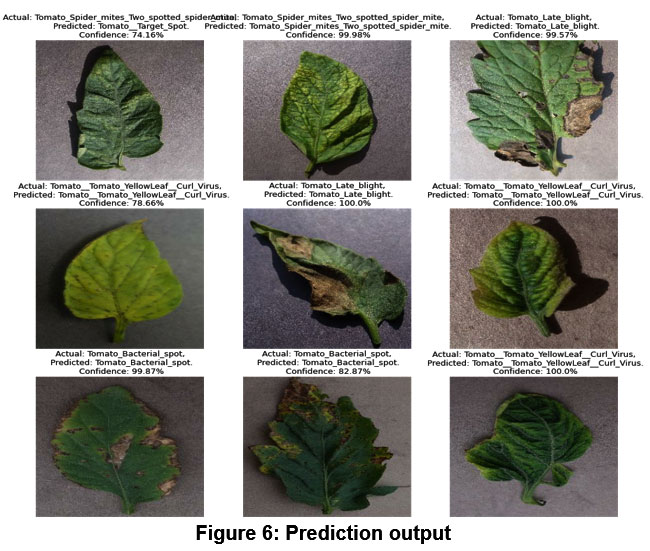 |
Figure 6: Prediction output |
System flow for prediction is as shown in figure 2, we’re using model. Load to load the model that to be saved in local disk. The trained model’s result was obtained using prediction after the model had been loaded. In the prediction the different classes are defined as 0: ‘Tomato_Bacterial_spot’, 1:’Tomato_Early_blight’, 2:’Tomato_Late_blight’, 3:’Tomato_Leaf_Mold’, 4:’Tomato_Spider_mites_Two_spotted_spider_mite’, 5:’Tomato__Target_Spot’, 6:’Tomato__Tomato_YellowLeaf__Curl_Virus’, 7: ‘Tomato__Tomato_mosaic_virus’, 8:’Tomato_healthy’. The numeric values from 0 to 8 are represented in classification summery along with the precision, recall and f1 score of the respective class.
Conclusion
Classification of various plant leaf diseases has been analysed by various machine learning and other techniques. It is found that every technique has its own advantages and disadvantages depending on data availability and feature selection. Almost all the researchers presented outcomes for their experimentation for different databases with varied quantity and disease types along with image type. Some researchers compare the same datasets for various algorithms and presented their results and found all of them useful for leaf disease classification. Experimental results show that the CNN model outperforms other classic models in terms of accuracy, reaching 95.53% showing improved robustness and good performance.
Acknowledgement
The author would like to thank Dean Dr. Harsha Patil and all the staff of research department of Kalinga University for providing me with the necessary support to complete the research work.
Conflict of Interest
The author(s) has(have) no conflict of interest to declare.
Funding Sources
The author(s) received no specific funding for this work.
References
- Patokar, Arun M., and Vinaya V. Gohokar. “Classification of Tomato Leaf Diseases: A Comparison of Different Optimizers.” Classification of Tomato Leaf Diseases: A Comparison of Different Optimizers | SpringerLink, 1 Jan. 2023, https://doi.org/10.1007/978-981-19-6581-4_3.
CrossRef - U Sanath Rao, R Swathi, V Sanjana, L Arpitha, K Chandrasekhar, Chinmayi, Pramod Kumar Naik “Deep Learning Precision Farming: Grapes and Mango Leaf Disease Detection by Transfer Learning.” Deep Learning Precision Farming: Grapes and Mango Leaf Disease Detection by Transfer Learning – ScienceDirect, 12 Aug. 2021, https://doi.org/10.1016/j.gltp.2021.08.002.
CrossRef - Patokar, Arun M., and Vinaya V. Gohokar. “Precision Agriculture System Design Using Wireless Sensor Network.” Precision Agriculture System Design Using Wireless Sensor Network | SpringerLink, 13 Oct. 2017, https://doi.org/10.1007/978-981-10-5508-9_16.
CrossRef - Liu, Bin, et al. “Grape Leaf Disease Identification Using Improved Deep Convolutional Neural Networks.” Frontiers, 30 June 2020, https://doi.org/10.3389/fpls.2020.01082.
CrossRef - “Smart Farming for Improving Agricultural Management.” Smart Farming for Improving Agricultural Management – ScienceDirect, 6 Sept. 2021, https://doi.org/10.1016/j.ejrs.2021.08.007.
CrossRef - Arun M Patokar and Vinaya V Gohokar. “Design of Infrastructure for Precision Agriculture to Empower Farmers”. Acta Scientific Agriculture 2.12 (2018): 90-95.
- Sabrol, H., and K. Satish. “Tomato Plant Disease Classification in Digital Images Using Classification Tree.” 2016 International Conference on Communication and Signal Processing (ICCSP), IEEE, Apr. 2016. Crossref, https://doi.org/10.1109/iccsp.2016.7754351.
CrossRef - Hassanien, Aboul Ella, et al. “An Improved Moth Flame Optimization Algorithm Based on Rough Sets for Tomato Diseases Detection.” Computers and Electronics in Agriculture, vol. 136, Elsevier BV, Apr. 2017, pp. 86–96. Crossref, https://doi.org/10.1016/j.compag.2017.02.026.
CrossRef - Sabrol, Hiteshwari, and Satish Kumar. “Fuzzy and Neural Network Based Tomato Plant Disease Classification Using Natural Outdoor Images.” Indian Journal of Science and Technology, vol. 9, no. 44, Indian Society for Education and Environment, Nov. 2016. Crossref, https://doi.org/10.17485/ijst/2016/v9i44/92825.
CrossRef - Annabel, L. Sherly Puspha, and V. Muthulakshmi. “AI-Powered Image-Based Tomato Leaf Disease Detection.” 2019 Third International Conference on I-SMAC (IoT in Social, Mobile, Analytics and Cloud) (I-SMAC), IEEE, Dec. 2019. Crossref, https://doi.org/10.1109/i-smac47947.2019.9032621.
CrossRef - Hlaing, Chit Su, and Sai Maung Maung Zaw. “Tomato Plant Diseases Classification Using Statistical Texture Feature and Color Feature.” 2018 IEEE/ACIS 17th International Conference on Computer and Information Science (ICIS), IEEE, June 2018. Crossref, https://doi.org/10.1109/icis.2018.8466483.
CrossRef - Basavaiah, Jagadeesh, and Audre Arlene Anthony. “Tomato Leaf Disease Classification Using Multiple Feature Extraction Techniques.” Wireless Personal Communications, vol. 115, no. 1, Springer Science and Business Media LLC, June 2020, pp. 633–51. Crossref, https://doi.org/10.1007/s11277-020-07590-x.
CrossRef - Rangarajan, Aravind Krishnaswamy, et al. “Tomato Crop Disease Classification Using Pre-trained Deep Learning Algorithm.” Procedia Computer Science, vol. 133, Elsevier BV, 2018, pp. 1040–47. Crossref, https://doi.org/10.1016/j.procs.2018.07.070.
CrossRef - Jinzhu LU, et al. “Discrimination of Tomato Yellow Leaf Curl Disease Using Hyperspectral Imaging.” 2013 Kansas City, Missouri, July 21 – July 24, 2013, American Society of Agricultural and Biological Engineers, 2013. Crossref, https://doi.org/10.13031/aim.20131597646.
CrossRef - Wang YY, Li ZM, Wang L, Wang M. A scale invariant feature transform based method. J Inf Hiding Multimed Signal Process. 2013 :4(2) :73–89.
- Bay, Herbert, et al. “SURF: Speeded up Robust Features.” SURF: Speeded up Robust Features | SpringerLink, https://doi.org/10.1007/11744023_32.
CrossRef - Bay, Herbert, et al. “SURF: Speeded up Robust Features.” SURF: Speeded up Robust Features | (2006) SpringerLink,https://doi.org/10.1007/11744023_32.
CrossRef - Durmus, Halil, et al. “Disease Detection on the Leaves of the Tomato Plants by Using Deep Learning.” 2017 6th International Conference on Agro-Geoinformatics, IEEE, Aug. 2017. Crossref, https://doi.org/10.1109/agro-geoinformatics.2017.8047016.
CrossRef - Durmuş, E. O. Güneş and M. Kırcı, “Disease detection on the leaves of the tomato plants by using deep learning,” 2017 6th International Conference on Agro-Geoinformatics, Fairfax, VA, USA, 2017, pp. 1-5,https://doi.org/10.1109/Agro-Geoinformatics.2017.8047016.
CrossRef
- Suryawati, Endang, et al. “Deep Structured Convolutional Neural Network for Tomato Diseases Detection.” 2018 International Conference on Advanced Computer Science and Information Systems (ICACSIS), IEEE, Oct. 2018. Crossref, https://doi.org/10.1109/icacsis.2018.8618169.
CrossRef - Ferdouse Ahmed Foysal, Md., et al. “A Novel Approach for Tomato Diseases Classification Based on Deep Convolutional Neural Networks.” Proceedings of International Joint Conference on Computational Intelligence, Springer Singapore, July 2019, pp. 583–91. Crossref, https://doi.org/10.1007/978-981-13-7564-4_49.
CrossRef - Sardogan, Melike, et al. “Plant Leaf Disease Detection and Classification Based on CNN With LVQ Algorithm.” 2018 3rd International Conference on Computer Science and Engineering (UBMK), IEEE, Sept. 2018. Crossref, https://doi.org/10.1109/ubmk.2018.8566635.
CrossRef - Elhassouny, Azeddine, and Florentin Smarandache. “Smart Mobile Application to Recognize Tomato Leaf Diseases Using Convolutional Neural Networks.” 2019 International Conference of Computer Science and Renewable Energies (ICCSRE), IEEE, July 2019. Crossref, https://doi.org/10.1109/iccsre. 2019.8807737.
CrossRef - Ma J., Li X, Wen H., Chen Y.Y., Fu Z.T, Zhang L., “Monitoring video capture system for identification of greenhouse vegetable diseases” 2015. Nongye Jixie Xuebao/Transactions of the Chinese Society for Agricultural Machinery Mach 2015:46(3):pp.282–287.
- Sreedevi, Alampally, and Chiranjeevi Manike. “A Smart Solution for Tomato Leaf Disease Classification by Modified Recurrent Neural Network With Severity Computation.” Cybernetics and Systems, Informa UK Limited, Sept. 2022, pp. 1–41. Crossref, https://doi.org/10.1080/01969722. 2022.2122004.
CrossRef