

Introduction
Production Efficiency as a Powerful Tool in measuring the Performance of a Tea Garden
Like any other agricultural production, the tea production at plantation level involves transformation of some goods and services called input into other goods called products or output 1. Agricultural productivity (AP) is defined in agricultural geography as well as in economics as “output per unit of input ” or “output per unit of land area”, and the improvement in agricultural productivity is generally considered to be the results of a more efficient use of the factors of production, viz. physical, socioeconomic, institutional and technological 2. The AP depends on two components, which are as follows 3:
Production technology (PT)
It is characterized by the type and quality of inputs and resources used in the production process. For a given commodity like tea, many different technologies may exist, reflecting different economic, environmental and agronomic conditions.
Technical efficiency (TE):
It refers to ability of the production process to combine the available resources or inputs to produce maximal output (GTL). A tea farm is technically inefficient when it does not produce the maximum level of output that can be expected given the type of available inputs.
The productivity variation has a significant impact on the production of tea in the case of TGs. Productivity in the case of any TG is defined as the “yield of tea grown per hectare or per area of land” 1. The overall efficiency (OE), consisting of both the consisting of both the TE and allocative efficiency (AE)1 of individual TG 4 is known as the economic efficiency (EE) of the individual TG. It refers to the ability of the TG to minimize the cost of cultivation without altering the desired yield of GTL from the farms. Lowering costs while preserving productivity means higher profits, which is why EE is a common strategic goal 5. In practice, a technically efficient farm can be economically inefficient, whereas the reverse may not be true. It is especially true in developing countries where markets are often thin or inexistent, inputs are constrained (unavailable or difficult to access), and transaction costs are high 3 . The term “efficiency (η)” signifies a peak level of performance that uses the least amount of inputs to achieve the highest amount of output. Efficiency analysis serves as one of the most powerful tools to understand how inputs are translated into valued outputs 6. An efficient TG will reduce the number of unnecessary resources used to produce a given output (GTL), including personal time and energy. Efficiency is a measurable concept that can be determined using the ratio of useful output to total input. It minimizes the waste of resources such as physical materials, energy, and time while accomplishing the desired output 7.
Allocative efficient unit employs factors of production up to the point where the marginal rate of technical substitution between any two of its inputs equals the ratio of corresponding input prices.
Benchmarking – a Technique for establishing gaps in Performance of a Tea Garden
The word ‘benchmark’ originated from a surveyor’s mark cut to indicate a level for the determination of altitude 8. Benchmarking of tea productivity (TP) may be considered as a management technique, in which measurement is primarily comparative. A TG could attempt benchmarking at several levels using all the different types of benchmarking with the purpose to find out the best practices so that it could confirm to it. Typically to benchmark TP among a homogenous set of TGs, the “best practice benchmarking or process benchmarking” technique is generally applied to compare the methods and practices for performing tea production processes 9. Our study mainly focuses on the benchmarking TP of TGs on the basis of TE, assuming that the TGs use same quality of inputs and resources in the production process. The optimal productivity target which has to be compared to observe TP to measure the degree of TE {or technical inefficiency (TI)} at the farm-level is theoretically known as the production frontier 3. From the definition of TE, it is clear that it is a relative measure, not an absolute measure and can be measured by two different ways viz. output oriented technical efficiency (TEoo) and input oriented technical efficiency (TEio) 10.
Methods for Benchmarking of Tea Farms
In modern benchmarking the two main approaches are SFA and DEA 11.
Parametric Stochastic Frontier Analysis (SFA):
The first prominent concept on modeling and estimation of SFA is forwarded by the empirical work of the concept of a stochastic production frontier (SPF) was developed and extended by Aigner, Lovell, and Schmidt in 1977. Further, Battese and Coelli in 1995, Greene in 1990 and Wim and Broeck in 1977 provided a significant contribution for the progress of SFA considering different distributional assumption of the error term 12. Typically, the production or cost model is based on a Cobb – Douglas (CD) function 13 or translog (TL) function 4. Based on the different distributional assumption of the error terms, the SFA approaches can be modeled in the different ways viz., Half Normal model, Truncated Normal model, Exponential model 14 and Gamma model 15. The production function under stochastic frontier distinguishes the error term associated with the production function in to statistical noise and inefficiency components. It is assumed that each component has their influence in deviating output from the most possible maximum level. The statistical noise or uncontrolled component is the error due to randomness which is two-sided. For example noise components like weather, climatic condition or any unexpected event may either increase or decrease the yield of tea in the tea farm, which is beyond the control of the cultivator. On the other hand, production inefficiency component is only due to inefficiency in allocating resources which is a one-sided error. This error has a negative impact on the production function and can be controlled by the cultivator with appropriate measures 12.
The focus of all 15 papers (71.43%) utilizing the SFA techniques is to examine the efficiency levels of TGs through the estimation of TE. 16 has foreground benchmarking of TGs of Vietnam on the basis of Resource Use Efficiency (RUE) of these by application of this method. In addition to the estimation of TE, 17 used the SFA cost function to find out the reason for variation in the Total Cost of Production (TCP) of GTL. Further, the researcher calculated the EE of two different sets of small tea growers (STG)s and used the Mann-Whitney U Test (Wilcoxon Rank-Sum Test) to find the difference in the efficiency levels of the two independent groups of STGs. Similarly, 18 used the Aigner et al. (1977) and Meeusen & Broek (1977) SFA production and cost functions in CD form to calculate the TEmean and average Cost Efficiency (CE)1{CEmean} scores of the levels of organic STGs respectively . The researchers subsequently used these values to estimate the EE levels of the set of STGs.
CE for an individual STG is estimated as the ratio of the predicted minimum cost of production to the observed cost of production from the SFA cost function in CD form, and AE of the respective STG is the reciprocal of its CE.
Non – parametric Data Envelopment Analysis (DEA)
Initially put forward by Charnes, Cooper and Rhodes in 1978 and further enhanced by Banker, Charnes and Cooper in 1984 19, DEA being a nonparametric approach does not require a functional form specification and is easy to compute using linear programming. In case of tea industry, it considers each tea farms (termed as ‘decision making units’ or DMU) and calculates a discrete piecewise frontier determined by the set of efficient tea farms or best practice units. It makes a comparative analysis of the tea farms that utilizes multiple inputs to produce multiple outputs which can be quantified using different units of measurements. Each DMU has the flexibility with respect to some of the decisions it makes, but not necessarily complete freedom is given with respect to these decisions. This method cannot separate the effect of noise and effects of inefficiency during the calculation of TE; and is less sensitive to the type of specification error. The most popular models of DEA widely used to carry out research work 20 are as follows:
CCR model: This was the first DEA model was suggested by Charnes, Cooper and Rhodes in the year 1978 and is based on the constant return to scale (CRS) assumption. The efficiency measured under CRS assumptions represents the technical efficiency (TE or TECRS).
BCC model: Banker, Charnes and Cooper (1984) further extended the work of Charnes, Cooper and Rhodes, keeping into consideration the various factors might cause a tea farm to deviate from its optimal scale of operations, thus accounting for variable returns to scale (VRS). The efficiency measured under CRS assumptions represents the pure technical efficiency (PTE or TEVRS).
Both the models are used simultaneously in various empirical studies on TE of tea farms to estimate their scale efficiency (SE)[3]. The focus of the majority of the studies by application of DEA is on evaluating TE scores. However, 21 and 22 used DEA method for determination of SE scores in addition to TE scores. Later on 23 benchmarked TGs of Turkey on the basis of TE, SE, AE, EE and PTE scores by application of this method.
Determinants of Technical Efficiency
The various factors affecting the TE of TGs can be determined using different models of Multiple Regression (MR)4. Our studies revealed that the TE of the TPS at plantation level is dependent on numerous factors which are stated as follows:
Moment or time at which the TE is evaluated (t)
Tea farm characteristics (F)
location of tea farm (FLOCATION),
Age of tea farm or bushes (FAGE),
Tea clone or variety (FTEA VARIETY),
uninterrupted operation status of farm (FOPERATE),
extent of commercialization of tea farm (FCOMMERCIALIZATION),
certification of tea farm (FCERTIFICATION),
farm’s contract to sell product or with Government Cooperatives (FCONTRACT TYPE)
Environmental factors (E):
slope of tea land (ELAND SLOPE),
altitude at which the tea farm is located (EALTITUDE),
erosion risk (EEROSION RISK)
Socio-economic characteristics of tea farmers (P)
farmer’s age (PAGE),
farmer’s access to extension service5(PEXTENSION SERVICE),
farmer’s experience in tea farming (PEXPERIENCE),
farmer’s educational qualification (PEDUCATION),
farmer’s gender as masculine (PGENDER),
farmer’s primary occupation as tea (POCCUPATION),
farmer’s income level (PINCOME),
farmer’s perception or adaptation on/of resource conservation or waste management methods or resource conservation technology (PRESOURCE CONSERVATION),
famer’s household size (PFAMILY SIZE),
farmer’s affiliation to any group or organization (PAFFILIATE),
farmer’s registration with concerned Tea Board (PREGD.),
farmer’s ethnicity6 (PETHNICITY),
farmer’s adaptation of good agricultural practices (GAP) {(PGAP)},
farmer’s migration status (PMIGRATION STATUS)
farmer’s access to marketing channel to sale green leaf (PMARKETING CHANNEL),
farmer’s dependency ratio (PD-RATIO),
farmer’s access to credit (PCERDIT),
availability of livestock at farmer’s household (PLIVESTOCK)
Availability of infrastructure facilities (INFRA)
irrigation facilities (INFRAIRRIGATION),
own transport facility (INFRAOWN TRANSPORT)
Total value of farm produce of yield from tea farms (Y)
Status of labour employed in tea farms (N)
outsourced or hired labour (NHIRED),
family labour or household labour (NFAMILY),
age of the agricultural labour force (NAGE)
Status7 of land under cultivation (TSTATUS)
Mode8 of cultivation (CMODE)
Resources for production of green tea leaf (Q)
area under tea cultivation (QT),
quantity of labour engaged (QLABOUR),
quantity of fertilizer applied (QFERTILIZER),
quantity of foliar nutrients (QFN),
quantity of pesticides (QPEST),
quantity of green leaf outsourced (QGL-OUT),
number of outsourced tea gardens or STGs (QOUT-STG),
amount of capital expenditure (CapEx)
Objective
The intention of this study is to find the limitations and ambiguity in the existing investigations carried out in estimation or determination of TE of TGs; and subsequently finds the impact of various factors on the TE of these TGs. These significant research works may be referred by other researchers to investigate the performance of the STGs in other unexplored regions of the world, where there has been no study conducted so far. Also, a significant statement was made by the erstwhile Commerce Secretary, Government of India that the tea industry should benchmark itself against best practices so that it can compete in international market against countries like Kenya and Sri Lanka 24. This will help the industry to solve its fundamental challenges on decline in productivity. With a steep hike in the input cost, the tea industry should make an attempt to utilize the available resources judiciously, i.e., without making any wastage of the resources and achieve the optimal level of production for its self sustainability in the competitive environment. It may be noted that these literatures will enable the researchers to identify the factors which are responsible for causing the (in) efficiency in the tea production system and subsequently adopt strategies to rectify the same.
Methodology
To systematically highlight the quantity, status of research work done, and the scope for the future research, an investigation for the TE for the tea sector was searched from all the accessible/ available published paper using “technical efficiency (of) OR (in) tea” as the phrase with the above mentioned keywords in the academic search engine Google Scholar was used for retrieving relevant literature. In addition to this records were identified through other sources. From retrieved literature, relevant investigations carried out during the period 2012-2022 in top tea producing counties in the world were taken into consideration. The studies which investigated the TE of only the TGs {special focus on small tea grower/ gardens (STG)} were included for the systematic review, excluding the tea processors and tea estates. The results from the academic search engine and other sources were filtered by using inbuilt advanced searched operators 25 and Boolean operators 26. The empirical works carried out using only the two common methodologies viz., Parametric SFA and Non – parametric DEA were taken into consideration. The following diagram is the pictorial representation of the systematic literature review methodology using PRISMA flow diagram.
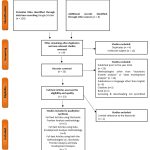 |
Figure 1: Graphical representation of systematic literature review using PRISMA flow diagram 27 |
Major Findings And Discussion
The research work carried out on estimation of TE worldwide on different commodities is plentiful. However, the researches carried out on TE of tea farms are scarce. About 21 studies from all over the world were investigated by the researchers and the computed TEmean of TGs is around 67.98%. This indicated that that there is considerable space to increase GTL yield in tea cultivation without additional inputs and given existing production technology The studies have been conducted in developed and developing countries with tea growing areas to determine or estimate the TE of the tea farms at plantation level. Sri Lanka accounts with highest number of studies (6 or 28.57%), followed by India (5 or 23.81%), Vietnam (3 or 14.29%), China & Kenya (each 2 or 9.52%), and Turkey, Zimbabwe & Malawi (each 1 or 4.76%). The TEmean of the tea farms was found to be highest in Zimbabwe (0.79) followed by India (0.74), Vietnam (0.68), Malawi (0.67), Turkey (0.65), Sri Lanka & China (each 0.64) and Kenya (0.48). A study conducted in Sri Lanka by 28 highlighted that the TEmean of migrant STG 9 (TEmean-MIGRANT) (0.7767) is greater than that of non-migrant farms (TEmean-NON-MIGRANT) (0.6269) were calculated as 0.7767 and 0.6269 respectively. Another study conducted in Sri Lanka by 29 revealed that TEmean of UTZ certified10 STGs (TEmean-UTZ) (0.517) is comparatively less than that of Non-UTZ STGs (TEmean-NON-UTZ) (0.596). The major findings from the above research works have been tabulated in Table (1), (2) and (3) followed by an interpretation on the same.
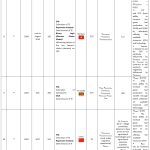 |
Table 1: Tabulation of Empirical Work on Estimation of Technical Efficiency of Tea Farming System using Stochastic Frontier Analysis (SFA) |
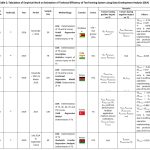 |
Table 2: Tabulation of Empirical Work on Estimation of Technical Efficiency of Tea Farming System using Data Envelopment Analysis (DEA). |
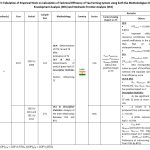 |
Table 3: Tabulation of Empirical Work on Calculation of Technical Efficiency of Tea Farming System using both the Methodologies: Data Envelopment Analysis (DEA) and Stochastic Frontier Analysis (SFA) |
Where, (COP) STG = COP in STGs, (COP) BTG = COP in BTGs
Interpretation of the studies using SFA technique
A major portion of the studies reviewed used the SFA technique to estimate the plantation level TE of TGs as stated in Table (1) above. The TEmean of TGs from these 15 (71.43%) studies was 0.683064. The researchers used the production or cost model based either on a CD function or TL function in estimating the production and/or cost frontier. The use of various SFA models by the investigators in their studies is stated below:
| Sl. No. | SFA Model | Studies |
| 1 | TL-SFA model | 30, 31, 16, 29 |
| 2 | CD-SFA model | 17, 32, 34, 35, 18, 36, 37, 39 |
| 3 | Both TL-SFA & CD-SFA models | 28, 33, 38 |
Interestingly, to calculate the EE of TGs 17 and form 18 used CD-SFA production and cost models in their studies. 16 utilized the TL-SFA production model to estimate the TEio and the TEoo of a sample TGs in Vietnam. The value of TEio (0.9229) was found to be greater than that of TEoo (0.8221) which indicated that the sample has the capacity to decrease the observed level of all inputs by 17.79% without compromising the contemporary level of output. Interestingly, an investigation carried out by 38 in China revealed that the TEmean of STGs estimated by considering production model in CD-SFA form (0.661856) and TL-SFA form (0.674684) gave almost same results. Moreover, it was observed that both these frontier models adapted in the studies can be applied to a single cross section as well as to panel data.
The various statistical techniques applied by the researchers in their studies to analyze the effect of various factors on the TE of TGs are stated below:
| Sl. No. | Statistical Technique | Studies |
| 1 | Bootstrapping | 30 |
| 2 | OLS Estimates | 36, 38 |
| 3 | MLE Estimates | 31, 17, 29, 34, 18 |
| 4 | MLE & OLS Estimates | 28, 37 |
| 5 | Tobit Regression Model | 16, 32, 39 |
| 6 | Regression Analysis | 33, 35 |
The significant contrasting outcomes from the studies using SFA technique is stated below, which opens up the door for future research:
| Sl. No. | Factor | Studies revealing the positive impact of it on TE | Studies revealing the negative impact of it on TE |
| 1 | PEXTENSION SERVICE | 30, 33, 18, 39 | 31, 17, 32 |
| 2 | PEDUCATION | 30, 31, 17, 32, 33, 34, 35, 18, 37, 39 | 28, 16, 38 |
| 3 | PETHNICITY | 16, 36 | 30 |
| 4 | PAGE | 34, 36 | 28, 31, 16, 37, 38 |
| 5 | PAFFILIATE | 31, 34 | 16 |
| 6 | POCCUPATION | 32, 34, 37 | 31, 16 |
| 7 | FAGE | 16, 34 | 31, 33, 39 |
| 8 | FLOCATION | 32, 38 | 35 |
| 9 | QT | 38 | 35 |
Interestingly, the study conducted by 35 revealed that it was revealed that there exists an inverted U-shaped (non-linear) relationship between the TE and PAGE, and the turning point of age was found to be 42.813 years. In a recent study conducted in Sri Lanka by 37 found that the TEmean of the organic STGs is 0.247, which is lowest among all the studies conducted in the country. Contrary to this, an investigation carried out by 18 found that the TEmean of the STGs is 0.85, which is comparatively high than the TEmean of the STGs calculated from other studies in the country. A similar study conducted by 33 in the Vi Xuyen district, Ha Giang province of Vietnam revealed that TEmean for conventional tea production (CTP) cultivators {(TEmean)CTP} (0.701) higher than that of and organic tea production (OTP) cultivators {(TEmean)OTP} (0.652). it is noteworthy that, 33 adapted the Discrete Choice models in form of Binary Logit to determine the influencing factors of the tea farmer’s choice (decision) on OTP. The ambiguous outcomes related to the impact of organic conversion of tea farms on its TE in different nations will thus create a dilemma on the farmer’s decision to adopt organic tea farming.
Interpretation of the studies using DEA technique
Out of 21 studies reviewed it was found that 5 (23.81%) studies used DEA to determine the TE of the TGs at plantation level as stated in Table (2) above. The plantation level TEmean of TGs determined by this method is 0.676617. The studies reflected the use of both BCC and CCR models of DEA. The use of different models of DEA by researchers in carrying out their studies is stated below:
| Sl. No. | DEA Model | Studies |
| 1 | CCR | 21 |
| 2 | BCC (output oriented) | 40 |
| 3 | Both CCR & BCC | 22, 23, 41 |
The various statistical techniques applied by the researchers in their studies to analyze the effect of various factors on the TE of TGs are stated below:
| Sl. No. | Statistical Technique | Studies |
| 1 | Probit Regression Analysis | 21 |
| 2 | Descriptive Statistics | 40 |
| 3 | Fractional Regression Analysis | 22 |
| 4 | Double Censored Tobit Regression Analysis | 23 |
| 5 | Stochastic Frontier Regression Analysis | 41 |
It was notable that 23 conducted the VIF Diagnostic Test to check the multi-co linearity among the independent variables prior to the determination of the factors contributing to the efficiency of the TG farms.
The significant contrasting outcomes from the studies using DEA technique is stated below, which puts forth further avenues for research:
| Sl. No. | Factor | Studies revealing the positive impact of it on TE | Studies revealing the negative impact of it on TE |
| 1 | QT | 21, 40, 23 | 22, 41 |
| 2 | FLOCATION | 22 | 23 |
| 3 | PAGE | 23 | 21 |
Interpretation of the studies using both SFA and DEA technique:
The only study carried out by 42 in India reflected that the TEmean of the STGs determined by using DEA technique {(TEmean)DEA} is 0.8167 which was higher than that by using SFA {(TEmean)SFA}in the same set of data (0.62), as it takes into account the data noise such as errors and omitted variables. The study also found that the means of procurement of leaf from STGs by the large tea estates (BTG) has been adopted on the ground of CE or cost of production (COP) of GTL.
Conclusion
It can be concluded that to raise the efficiency and productivity of the tea farms, it becomes imperative to quantitatively measure the existing level of TE and policy options available for raising the present level of efficiency, given the fact that efficiency of production is directly related to the overall productivity of the plantation sector. The empirical evidence is very important in identifying the factors that threaten the productivity of these units and in generating information for designing of support policies for the small tea gardens and institutional improvement.
Future Outlook
The impact of various factors on their TE had contradictory outcomes in different studies. To validate such contradictions, a further investigation is required to be carried out to find the impact of such factors on the TE of the tea farms in different geographical locations.
The quality parameters of the tea farms were not taken into consideration in any of the studies to benchmark the best practicing farm, which opened up the scope to carry out investigation incorporating the quality aspect of the tea farms to measure the performance of the farms.
Acknowledgement
We must render our sense of gratitude to the School of Management and Entrepreneurship, Assam Rajiv Gandhi University of Cooperative Management, Sibsagar, Assam, India for providing the entire valuable input relevant for the study and availing the library facility.
Conflict of Interest
All the authors declare that there is no conflict of interest with any authority.
Funding Source
The authors received no financial support for this research.
References
- Das K. THE SMALL TEA GROWERS OF ASSAM : A STUDY OF THEIR MONOPSONISTIC EXPLOITATION AND PRODUCTION Doctor of Philosophy By Indian Institute of Technology Guwahati Department of Humanities and Social Sciences. 2019;(July).
- Dharmasiri LM. Measuring Agricultural Productivity Using the Average Productivity Index (API). Sri Lanka J Adv Soc Stud. 2012;1(2):25-44. doi:10.4038/sljass.v1i2.4855
CrossRef - Productivity and Efficiency Measurement in Agriculture – Literature Review and Gaps Analysis.; 2017. Accessed December 10, 2021. https://www.fao.org/3/ca6428en/ca6428en.pdf
- Asmare E, Begashaw A. Review on Parametric and Nonparametric Methods of Efficiency Analysis. Biostat Bioinforma. 2018;2(2):1-7. doi:10.31031/OABB.2018.02.000534
- Mack S. What Is Technical Efficiency? Chron. Accessed March 2, 2022. https://smallbusiness.chron.com/technical-efficiency-65019.html
- Papanicolas I, Smith PC. Theory of System Level Efficiency in Health Care. Encycl Heal Econ. Published online January 1, 2014:386-394. doi:10.1016/B978-0-12-375678-7.00203-0
CrossRef - Banton C. Efficiency Definition. Investopedia – Dotdash Meredith. Published 2020. Accessed March 2, 2022. https://www.investopedia.com/terms/e/efficiency.asp
- Town JS. Benchmarking and Performance Measurement. In: Northumbria International Conference on Performance Measurement in Libraries and Information Services. Director of Information Services, Cranfield University (Royal Military College of Science), Shrivenham; 1995:83-88. https://files.eric.ed.gov/fulltext/ED405869.pdf
- Sekhar SC. Benchmarking. African J Bus Manag. 2010;4(6):882-885. https://academicjournals. org/journal/AJBM/article-full-text-pdf/94C94A923521
- Porcelli F. Measurement of Technical Efficiency . A brief survey on parametric and non-parametric techniques. Published online 2009:1-27. http://citeseerx.ist.psu.edu/viewdoc/download?doi=10.1.1.232.4843&rep=rep1&type=pdf
- Strange N, Bogetoft P, Aalmo GO, Talbot B, Holt AH, Astrup R. Applications of DEA and SFA in benchmarking studies in forestry: state-of-the-art and future directions. Int J For Eng. 2021;32(S1):87-96. doi:10.1080/14942119.2021.1914809
CrossRef - Tirkaso WT. The Role of Agricultural Commercialization for Smallholders Productivity and Food Security -An Empirical Study in Rural Ethiopia: Master’s Thesis. Published online 2013. doi:10.13140/RG.2.2.17531.41761
- Kokkinou A. A note on theory of productive efficiency and stochastic frontier models. Eur Res Stud J. 2010;13(4):109-118. doi:10.35808/ersj/302
CrossRef - Sakouvogui K, Shaik S, Doetkott C, Magel R. Sensitivity Analysis of Stochastic Frontier Analysis Models. Monte Carlo Methods Appl. 2021;27(1):71-90. doi:10.1515/mcma-2021-2083
CrossRef - Greene WH. A Gamma-distributed Stochastic Frontier Model. 1990;46:141-163. https://pages.stern.nyu.edu/~wgreene/FrontierModeling/Reference-Papers/Greene-JE1990-GammaFrontier_1.pdf
CrossRef - Hong NB, Yabe M. Resource Use Efficiency of Tea Production in Vietnam : Using Translog SFA Resource Use Efficiency of Tea Production in Vietnam : Using Translog SFA Model. 2015;(August). doi:10.5539/jas.v7n9p160
CrossRef - Lama B. EFFICIENCY LEVELS OF SMALL TEA GROWERS IN UDALGURI. Published online 2016. http://14.139.206.50:8080/jspui/bitstream/1/4726/1/Bondona Lama M.Phil Thesis 2016.pdf
- Gogoi M, Buragohain PP. A Study of Economic Efficiency of Organic Tea Growers of Dibrugarh District of Assam. Assam Econ J. 2019;19:84-111. https://www.researchgate.net/profile/Manuranjan-Gogoi/publication/340428515_A_STUDY_OF_ECONOMIC_EFFICIENCY_OF_ORGANIC_TEA_GROWERS_OF_DIBRUGARH_DISTRICT_OF_ASSAM/links/60ed72259541032c6d36fec4/A-STUDY-OF-ECONOMIC-EFFICIENCY-OF-ORGANIC-TEA-GROWERS-OF-DIBRUG
- Beasley JE. OR NOTES. Brunel University London. http://people.brunel.ac.uk/~mastjjb/jeb/or/ dea.html
- Leal Paço C, Cepeda Pérez JM. The use of DEA (Data Envelopment Analysis) methodology to evaluate the impact of ICT on productivity in the hotel sector. Via@ – Int Interdiscip Rev Tour. 2013;(3):1-13. doi:10.4000/viatourism.1005
CrossRef - Dube L, Guveya E. Technical Efficiency of Smallholder Out-grower Tea (Camellia Sinensis) Farming in Chipinge District of Zimbabwe. Greener J Agric Sci. 2014;4(8):368-377. doi:10.15580/gjas. 2014.8.091114354
CrossRef - Ateka JM, Onono PA, Martin E. Technical Efficiency and its Determinants in Smallholder Tea Production: Evidence from Nyamira and Bomet Counties in Kenya. Glob J Sci Front Res. 2018;18(03):43-54.
- Haq SU, Boz I. Estimating the efficiency level of different tea farming systems in Rize province Turkey. Cienc Rural. 2019;49(12). doi:10.1590/0103-8478cr20181052
CrossRef - PTI. Tea industry: Tea industry should benchmark itself: Commerce secretary, Retail News, ET Retail. The Economic Times. Published 2018. Accessed March 14, 2022.https://retail. economictimes. indiatimes.com/ news/food-entertainment/grocery/tea-industry-should-benchmark-itself-commerce-secretary/65981282
- How to use Google Scholar – WUR. Wageningen University & Research. Accessed May 15, 2022. https://www.wur.nl/en/article/how-to-use-google-scholar.html
- Introduction to Boolean Search. iCIMS. Published 2020. Accessed May 15, 2022. https://care.icims.com/s/article/Introduction-to-Boolean-Search
- Preferred Reporting Items for Systematic Reviews and Meta-Analyses – Wikipedia. Accessed June 13, 2022. https://en.wikipedia.org/wiki/Preferred_Reporting_Items_for_Systematic_Reviews_and_Meta-Analyses
- Dharmadasa RAPIS, Wijethilaka LWU. Impact of labor out-migration on technical efficiency of tea smallholders in low country wet zone. In: 11th International Conference on Business Management. Faculty of Management Science, University of Sri Jayewardenepura; 2014:89-106.
- Priyanath HMS, Premaratne SP, Yoosuf A, Maurice D. Technical Efficiency for Tea Smallholder Farmers under UTZ Certification System in Sri Lanka: A Stochastic Frontier Approach. SEISENSE J Manag. 2018;1(2):1-19. doi:10.5281/zenodo.1218820
- Nguyen-Van P, To-Thea N. Agricultural Extension and Technical Efficiency of Tea Production in Northeastern Vietnam.; 2014. doi:10.13140/RG.2.2.23927.21929
- De Silva TBYA, Rathnayaka RMSD. Impact of good agricultural practices on technical efficiency of Tea small holders. In: UWU Conference Proceedings – UWUCP. Uva Wellassa University; 2015. http://www.erepo.lib.uwu.ac.lk/bitstream/handle/123456789/8366/01-TEA-Impact of good agricultural practices on technical efficiency of Tea small holders.pdf?sequence=1&isAllowed=y
- Katungwe F, Elepu G, Dzanja J. Technical Efficiency of Smallholder Tea Production in South-Eastern Malawi: A Stochastic Frontier Approach. J Agric Sci. 2017;12(3):185-196. doi:10.4038/jas.v12i3.8265
CrossRef - To The N, Nguyen Tuan A. Efficiency and adoption of organic tea production: Evidence from Vi Xuyen district, Ha Giang province, Vietnam. Asia-Pacific J Reg Sci. 2018;3(1):1-17. doi:10.1007/s41685-018-0092-2
CrossRef - Jayakody S, Dishanka S. An Estimation of Technical Efficiency of Tea Smallholdings in Ratnapura District of Sri Lanka. J Soc Dev Sci. 2019;10(4):1-11. doi:10.22610/jsds.v10i4(S).2839
CrossRef - Liu J, Zhang C, Hu R, Zhu X, Cai J. Aging of agricultural labor force and technical efficiency in tea production: Evidence from Meitan county, China. Sustain. 2019;11(22):1-16. doi:10.3390/su11226246
CrossRef - Das K, Das D. Technical Efficiency in Small Tea Gardens of Assam. Published online 2020. doi:10.1177/0972266120916318
CrossRef - Kodagoda AH, Dharmadasa RAPIS. Technical efficiency of organic tea smallholders: Evidence from Uva region of Sri Lanka. J Agric Value Addit. 2020;3(1):43-59.
- Gessesse AT, He G. Land tenure and technical efficiency of smallholder tea producers: The case of ya’an city, china. E a M Ekon a Manag. 2021;24(2):21-34. doi:10.15240/TUL/001/2021-2-002
CrossRef - Jeewanthi DGM, Shantha AA. The Technical Efficiency of Small-scale Tea Plantation in Sri Lanka The Technical Efficiency of Small-scale Tea Plantation in Sri Lanka. Asian J Manag Stud. 2021;1(1):128-149. https://www.researchgate.net/publication/349287199_The_Technical_Efficiency_of_Small-scale_Tea_Plantation_in_Sri_Lanka_ASIAN_JOURNAL_OF_MANAGEMENT_STUDIES/link/6027db384585158939a0a63d/download
CrossRef - Majumdar TR. Productivity and Technical Efficiency of Smallholding Tea Plantations in North Bengal − A DEA Analysis. Anweshan J Educ. 2015;3(1):1-10. https://ir.nbu.ac.in/bitstream/ 123456789/2946/ 1/Article.5.pdf
- Tuitoek DK, Tison CC, Jebichii L. Analysis of Technical Efficiency of Small Scale Tea Production in Nandi Hills – Nandi County : A Data Envelopment Analysis Approach. Int J Res Innov Soc Sci. 2020;IV(Vi):149-163. https://www.rsisinternational.org/journals/ijriss/Digital-Library/volume-4-issue-6/149-163.pdf
- Majumdar TR. Economics of Small Tea Plantations in West Bengal − A Study of Production , Efficiency and Productivity Performance Using DEA and Stochastic Frontier Regression Department of Economics University of North Bengal. Published online 2017.
- Kouchaki-Penchah H, Nabavi-Pelesaraei A, O’Dwyer J, Sharifia M. Environmental Management of Tea Production Using Joint of Life Cycle Assessment and Data Envelopment Analysis Approaches. Environ Prog Sustain Energy. 2017;0(0):1-7. doi:10.1002/ep.12550
CrossRef - Moore AW, Anderson B, Das K, Wong WK. Combining Multiple Signals for Biosurveillance. Elsevier Inc.; 2006. doi:10.1016/B978-012369378-5/50017-X
CrossRef