
Introduction
In the tropical areas of the world banana is the most cultivated and widely consumed fruit.1 In tropical and subtropical countries of the World banana is widely distributed and consumed.2 3 It can be consumed cooked as well as uncooked. It can be easily and economically accessible to common people. 4 Presently India is one of the largest countries in terms of banana production.5 Among the various types of banana Cavendish and Velchi bananas are produced more in Maharashtra. With growing stage and maturity there is changes in the physical as well as chemical properties of banana. 6 7 The following table shows the top 5 states of India cultivating the banana in high numbers.
Table 1: Production (Tonnes) Year: 2021-22
|
Sr No. |
State |
Production |
Share (%) |
|
1 |
Andhra Pradesh |
5,838.88 |
17.99 |
|
2 |
Maharashtra |
4,628.04 |
14.26 |
|
3 |
Gujarat |
3,907.21 |
12.04 |
|
4 |
Tamil Nadu |
3,895.64 |
12 |
|
5 |
Karnataka |
3,713.79 |
11.44 |
|
6 |
Uttar Pradesh |
3,391.01 |
10.45 |
|
7 |
Bihar |
1,968.21 |
6.06 |
|
8 |
West Bengal |
1,147.79 |
3.54 |
|
9 |
Assam |
1,108.00 |
3.41 |
|
10 |
Chhattisgarh |
585.52 |
1.8 |
Source: National Horticulture Board (NHB), India, 2021-22 ( 1st Adv. Estimate)
The following table show the International Production of Banana
Table 2: International Production of Banana
|
Production in (000) MT: 2020 |
|||
|
Sr No. |
Country |
Production |
Share (%) |
|
1 |
India |
31,504.00 |
26.29 |
|
2 |
China P Rp |
11,513.00 |
9.61 |
|
3 |
Indonesia |
8,182.76 |
6.83 |
|
4 |
Brazil |
6,637.31 |
5.54 |
|
5 |
Ecuador |
6,023.39 |
5.03 |
|
6 |
Philippines |
5,955.31 |
4.97 |
|
7 |
Guatemala |
4,476.68 |
3.74 |
|
8 |
Angola |
4,115.03 |
3.43 |
|
9 |
Tanzania Rep |
3,419.44 |
2.85 |
|
10 |
Costa Rica |
2,528.72 |
2.11 |
|
|
Total |
84,355.64 |
|
Source: Food & Agricultural Organisation (FAO), India
Banana fruit undergoes various physical and chemical changes during the ripening stage. The study of physical and chemical changes helps in handling and distribution of banana fruit in postharvest, packaging and marketing stage. This study will help to design the system 8.
This paper aims to perform analytical study of two types of Bananas, Cavendish and Velchi. The study gives away the variation in physical and chemical properties of two varieties in unripe and ripen stages.9The paper includes analysis of physical properties like fruit weight peel and pulp weight, pulp to peel ratio and chemical properties like Brix value, Total Soluble Solids (TSS), pH value and firmness.10
Materials and Methods
Methods and materials used by researcher consists of selection of two types of bananas, recording their physical characteristics like weight, peel thickness, pulp weight, Peel to Pulp ratio, colour and chemical properties like total soluble solids, pH value, Firmness etc 11
Selection of Fruit
A freshly cut bunch of bananas of type Cavendish and Velchi were collected from College of Agricultural, Pune. Each day three bananas from the bunch are used. The experiment is done three times to get the uniform data and reduce the variations 12. Both types of bananas used for experiment were kept at room temperature between 220C to 270C for 10 days. In these days bananas were fully changed from totally unripe to fully ripe 13 14
Physical Characteristics
Fruit weight is measured daily by using the Electronic Kitchen Scale, model SF-400 having high precision strain gauge system. Peel weights were measured by peeling the banana. To measure the pulp weights peeled bananas were smashed uniformly and weighted. The Pulp to peel ratio was calculated by dividing the pulp weight to peel weight.
Chemical characteristics
Total soluble solids were measured daily using Handheld refractometer (Erma Inc, Tokyo, Japan). Each banana sample was smashed uniformly to get smooth pulp. A scoop of pulp was placed on main prism and closed day light plate to record the reading. The blue line indicated the TSS value.
The pH value was measured by standard pH meter by making the pulp more slurry. The firmness was determined by simple Hole Gauge Cone Penetrometer. The fruit was kept on surface and cone was inserted into it. Daily three fruits were taken from the bunch to measure the firmness’.
Results
The Various Physical characteristics such as Fruit Weight, Peel Thickness colour and Pulp weight and Chemical characteristics such as TSS(Brix), pH and Firmness of Cavendish Banana and Velchi banana were measured three times per day by the methods mentioned above and mean values are considered. The mean is calculated by using Advanced Microsoft Excel 2003 The following tables shows the readings for Cavendish and Velchi banana respectively.
Table 3: Physical and Chemical characteristics of Cavendish Banana
|
Day |
Fruit Weight(g) |
Peel thickness(g) |
Pulp weight(g) |
Pulp to peel ratio |
Colour |
TSS(Brix) |
pH |
Firmness(N) |
|
1 |
105 |
39 |
66 |
1.692 |
Green |
4.5 |
4.2 |
44.78 |
|
2 |
105 |
39 |
66 |
1.692 |
Green |
5 |
4.2 |
43.56 |
|
3 |
103 |
38 |
65 |
1.710 |
Green with slight yellow |
6 |
4.5 |
41.34 |
|
4 |
101 |
38 |
63 |
1.657 |
Green with slight yellow |
6.8 |
4.5 |
36.79 |
|
5 |
95 |
37 |
61 |
1.648 |
Green with more yellow |
7 |
5 |
35.23 |
|
6 |
93 |
34 |
58 |
1.705 |
Yellow |
8 |
5.1 |
34.23 |
|
7 |
91 |
32 |
57 |
1.781 |
Yellow |
12 |
5.2 |
31.89 |
|
8 |
87 |
32 |
57 |
1.781 |
Yellow with brown spot |
16.7 |
5.2 |
28.12 |
|
9 |
85 |
31 |
55 |
1.774 |
Yellow with browner spot |
19.5 |
5.2 |
24.78 |
|
10 |
82 |
30 |
52 |
1.733 |
Brown with slight shade of yellow |
23.7 |
5.4 |
22.1 |
Table 4: Physical and Chemical characteristics of Velchi Banana
|
Day |
Fruit Weight(g) |
Peel thickness(g) |
Pulp weight(g) |
Pulp to peel ratio |
Colour |
TSS(Brix) |
pH |
Firmness(N) |
|
1 |
71 |
18 |
58 |
3.222 |
Green |
5 |
4.5 |
40.89 |
|
2 |
69 |
17 |
56 |
3.294 |
Green with Yellow tip |
5.7 |
4.5 |
37.34 |
|
3 |
68 |
16 |
55 |
3.437 |
Yellow with Green tip |
7 |
4.6 |
35.34 |
|
4 |
67 |
15 |
52 |
3.466 |
Yellow |
8 |
4.6 |
31.67 |
|
5 |
66 |
13 |
52 |
4 |
Yellow with few brown spot |
13 |
4.8 |
30.56 |
|
6 |
65 |
12 |
50 |
4.166 |
Yellow with browner spot |
20 |
4.9 |
26.45 |
|
7 |
64.5 |
11 |
49 |
4.454 |
Yellow with brown at tip |
23 |
4.9 |
24.56 |
|
8 |
64 |
10 |
48 |
4.8 |
Brown with slight shade of yellow |
26 |
5 |
22.87 |
|
9 |
63.5 |
9 |
47 |
4.9 |
More Brown with shade of yellow |
26.5 |
5.1 |
21.47 |
|
10 |
63 |
9 |
46 |
4.8 |
Brown |
27 |
5.3 |
19.78 |
Discussion
Physical Properties
Banana Weight
As ripeness increases the weight of banana for both varieties decrease. This could be due to increase in moisture content and reduction in firmness. The different parameters were responsible for this mass weight reduction such as peel thickness, moisture content, post harvesting storage, fruit handling.15 The reduction in weight is observed as 21.83% for Cavendish Banana and 9.8% for Velchi Banana. The Standard Deviation for Cavendish and Velchi Banana is 8.51 and 2.61 respectively.
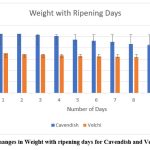 |
Figure 1: Changes in Weight with ripening days for Cavendish and Velchi Banana. |
Pulp to peel ratio
Initially the peel of both Bananas were very thick. The thick skin not only protects the fruit but also plays an important role in the entire ripening stages. The thickness reducing due to the modification of cell wall .16The average value for peel weight was reported as 35g and 14g for Cavendish and Velchi. The values reported by Kachru, R. P., Kotwaliwale are 41.9 and 18.4 17. The result shows that peel of Cavendish Banana has thicker skin and Velchi Banana. The Pulp to peel ratio was varied from 1.69 to 1.77 for cavendish and 3.2 to 4.8 for Velchi. This was due to decrease in peel thickness and increase in moisture content. The rapid increase of sugar causes the reduction in moisture. The pulp moisture content increasing due to osmotic transfer from peel to pulp and carbohydrate breakdown with the ripening stages.18 The standard deviation obtained for Cavendish and Velchi Banana is 0.04 and 0.75 respectively. Hence the pulp to peel ratio increasing with increase in the value of TSS. 19
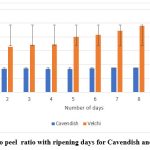 |
Figure 2: Pulp to peel ratio with ripening days for Cavendish and Velchi Banana |
Chemical Properties
Total Soluble Solids
The Total Soluble Solids (TSS) increasing with ripening days. The TSS values obtained are varied from 4.5% Brix to 23.7 % Brix and 5% Brix to 26 % Brix for Velchi. The magnitude of TSS depends on how the ripening is taking place organically or artificially. Many times, cultivators induce ethylene gas to speed up ripe in banana. Similar reading is reported in literature review 20 21.
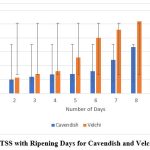 |
Figure 3: TSS with Ripening Days for Cavendish and Velchi Banana |
Firmness
The result shows that the firmness reducing with the ripening stages. This is due to the increase in the softness of pulp. The softness is majorly because of conversion of starch into sugar. The similar findings were also reported by Peleg in banana.22 23 The standard deviation obtained for Cavendish and Velchi banana is 7.71 and 7.19 respectively
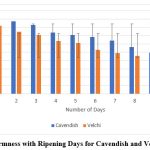 |
Figure 4: Firmness with Ripening Days for Cavendish and Velchi Banana |
pH
The pH value of banana increases gradually with ripening and decreases when over ripened. The pH value mainly depends upon the total amount of acids increasing during ripeness. Malic acid and citric acid are responsible for tartness and oxalic acid is responsible for taste of banana.24 25 26
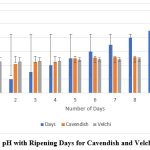 |
Figure 5: pH with Ripening Days for Cavendish and Velchi Banana |
Conclusion
The experimental and recorded data shows significant difference in physical and chemical properties in Cavendish and Velchi banana. With ripening days reduction in fruit mass weight is 21.83% and 9.3% for Cavendish and Velchi respectively. The peel weight reduces with ripening days. It was observed that peel of Cavendish was thicker compared to Velchi. It was observed that Cavendish banana when peel if turned brown the fruit is not advisable for consumption whereas for Velchi fruit it is a good condition to consume. The peel colour changes from green to brown with increasing in ripening days. The Cavendish banana takes more days to overripe compared to Velchi banana. The TSS value increasing with ripening days as a result the fruits are sweeter. Testing of chemical properties can cause the destruction in fruit sample so they can be tested in laboratory. This data can be useful to design a system at the time of transportation, processing, and marketing of banana.
Acknowledgement
The author is thankful to Dr. Vishwanath Karad MIT World Peace University, Pune for providing the Laboratory facility to carry out some part of the experiment.
Conflict of Interest
Author declares that there is no conflict of interest regarding publication of this paper.
References
- Preethi P, Balakrishna Murthy G. 2013. Physical and Chemical Properties of Banana Fibre Extracted from Commercial Banana Cultivars Grown in Tamilnadu State. Agrotechnol S11: 008. DOI: 10.4172/2168-9881.S11-008 Enhancements and Emerging Engineering Research;3 (02), 2347-4289.
- Mohammad, Z.I. and Saleha, A. Musa paradisiaca L. and Musa sapientum L. A 2011. Hytochemical and Pharmacological Review. Journal of Applied Pharmaceutical Science; 14-20.
- Singh, R., Kaushik, R. and Gosewade, S. Bananas. 2018. Underutilized Fruit Having Huge Potential as Raw Materials for Food and Non-Food Processing Industries: A Brief Review. The Pharma Innovation Journal; 7: 574-580.
- Raghuramulu, N., Madhuvan, N.K. and Kalyanasundharam, S. A. 2003. Manual of Laboratory Techniques. National Institute of Nutrition KMR, Hyderabad; 319-320
- Patil, S.K. and Shanmugasundaram S. 2015. Physicochemical changes during ripening, of Monthan banana, International Journal of Technology.
- Emaga, T.H., Robert, C., Ronkart, S.N., Wathelet, B. and Paquot, M. 2008. Dietary Fibre Components and Pectin Chemical Features of Peels during Ripening in Banana and Plantain Varieties. Bioresource Technology; 99: 4346-4354. https://doi.org/10.1016/j.biortech.2007.08.030
CrossRef - Sreedevi L. and Divakar Suma. A April 2015. Comparative Quality analysis of Banana (var palayamkodan), International Research Journal of Biological Sciences, ISSN 2278-3202; Vol. 4(4) :6-11.
- Tapre A.R., Jain R.K. April-June 2012. Study of Advanced maturity stages of banana. International Journal of Advanced Engineering Research and Studies. E-ISSN2249–8974; Vol I, Issue III :272-274.
- Asutosh Mohapatra, Bhosale Yuvraj K. and S. Shanmugasundara. 2016. Physicochemical changes during ripening of red banana, International Journal of Science, Environment and Technology, ISSN 2278-3687 (O); Vol. 5, No 3 :1340 – 1348.
- Merlene, A.B., Suriyakalu, M.A. and Gothandown, K.M. 2012. Varietal Impact on Phyto Chemical Contents and Antioxidant Properties of Musa accuminata (Banana). Journal of Pharmaceutical Science and Research 4: 1950-1955
- Kookal, S.K. and Thimmaiah, A. 2018. Nutritional Composition of Staple Food Bananas of Three Cultivars in India. American Journal of Plant Sciences; 9: 2480-2493. https://doi.org/10.4236/ajps.2018.912179.
CrossRef - Seymour G.B., Taylor J.E. and Tucker G.A. Biochemistry of Fruit Ripening. Chapman & Hall, London.
CrossRef - Thompson AK. 1996. Postharvest treatments, in Postharvest Technology of Fruit and Vegetables, ed. By Thompson AK. Blackwell Publishing. Oxford; pp. 95–124.
- John P, Marchal J. 1995. Ripening and biochemistry of the fruit. In: Gowen S (ed) Banana and plantains. Chapman and Hall, London; pp 434–467.
CrossRef - Mohapatra D., Sabayasachi M. and Namrata S. 2010. Banana and its by-products utilisation: an overview, Journal of Scientific and Industrial Research; 69: 323-329.
- R. and Maalekuu B.K. 2013. The effect of harvesting stage on fruit quality and shelf- life of four tomato cultivars (Lycopersicon esculentum Mill), Agriculture and Biology Journal of North America; 4(3): 252-259.
CrossRef - Kachru, R. P., Kotwaliwale, N and Balasubramanian, D. 1995. Physical and mechanical properties of green banana (Muss paradisiaca) fruit. Journal of Food Engineering; 26: 369-378
CrossRef - Kulkarni SG, Kudachikar VB, Keshava Prakash MN. December 2011. Studies on physico-chemical changes during artificial ripening of banana (Musa sp) variety ‘Robusta’. J Food Sci Technol, 48(6):730-4. doi: 10.1007/s13197-010-0133-y.
CrossRef - Palmer J.K. 1971. Biochemistry of Fruits and Their Products, London: Academic Press; 2: 65- 105.
- Hibler M. and Hardy D. 1994. Breeding a better banana, IDRC Report; 22(1): 16-18.
- Salvador A., Sanz T., and Fiszman S.M. 2007. Changes in color and texture and their
relationship with eating quality during storage of two different dessert bananas, post-harvest
Biology and Technology; 43:319-325. - Peleg M. Textural changes in ripening of banana. J Texture Stud; 7:457–463
CrossRef - R. Khande and S. Rajapurkar. Smart Voice and Gesture Controlled Wheelchair. 6th International Conference on Trends in Electronics and Informatics (ICOEI), Tirunelveli, India; pp. 413-417, doi: 10.1109/ICOEI53556.2022.9777223.
CrossRef - Seymour G.B., Taylor J.E. and Tucker G.A. Biochemistry of Fruit Ripening. Chapman & Hall, London;
CrossRef - S V Nikam et al IOP Ser.: Mater. Sci. Eng.; 2022; 1258 012012 DOI 10.1088/1757-899X/1258/1/012012
CrossRef - Terra, N.N.; Garcia, E.; and Lajolo, F. M. 1983. Starch sugar transformation during banana ripening: The behaviour of UDP glucose Pyrophosphorylase, Sucrose Synthetase and Invertase. Journal of Food Science; 48: 1097-1112
CrossRef