
Introduction
Inputs and output of crops are two important determinants for the measurement of crop efficiency. The inputs are important to produce the output in crop cultivation. Two types of inputs are generally used in the crop production process e.g., the intermediate inputs and factors of production. The intermediate inputs are defined as, ‘the inputs, which entirely used during one cropping season’, e.g. fertilizers, seeds, irrigation water, electricity and fuel 1. The factors of production are generally three types: land, labour and fixed assets 1. These three are the most essential inputs for the crop cultivation. Among these three inputs, labour is an essential factors of crop production 1,2. The output defined as ‘the total production of crops which are derived after the harvesting of crops. It may be gained as two ways i.e. the quantities and values 1,3.
Crop productivity (or crop yield) is one of the important and essential indicators for agricultural development 4 and it means the crop production per unit area. Simply, the productivity of a crop can be defined by dividing the total harvested product of a crop by the area of that crop 5.
The measurement of crop productivity and efficiency are fundamental content in agriculture 6. The crop productivity depends on the various factors such as the optimum use of inputs, soil physical and chemical characteristics and climate factors. The productivity measurement can be made in two levels, i.e. at the farm level and at the commodity level 2. In the present investigation the commodity level productivity has been computed for the three seasonal crops of the study area.
The investment of inputs in crop cultivation is an important dominating factor to control the profitability of agriculture in West Bengal. The cost of crop production can be decreased by increasing the investment of organic fertilizer rather than the chemical fertilizer 7. The vegetables, mustard and potato are high profitable crops than the rice 7. The yield of rice can be increased by the efficient input management in West Bengal 8. The cost of production of the major crops has increased at a high rate than the rate of output during 1990-91 to 2014-15 in India 9. The profitability of crops depends on the cost of crop production 10.
The large amount of chemical fertilizer, pesticides and herbicides use can increase the crop production, but this also leads a complex problem, including the decrease in organic matter content, loss of biodiversity, soil acidification and different health problems of human as well as environment 11. Organic fertilizer can also increases the crop yield without depleting the soil efficiency 11. Organic fertilizer creates high economic benefit than the chemical fertilizer. Crop yield also significantly affected by the duration of fertilization. The use of chemical fertilizer, organic fertilizer or a combination of both can effectively increase the crop yield 12. Another study conducted in the Hooghly district of West Bengal state show that the use of chemical fertilizer in agricultural practice has failed to increase the production and yield of crops 13.
West Bengal is the highest rice and jute producing state of India 14. The rice is the leading substance for the people of West Bengal state, about 76 %, 24% and 4% of the total net sown area is cultivated to aman (monsoon), boro (summer) and aus (autumn) rice respectively 15. The yield of aman rice was positively correlated with both chemical and organic fertilizer i.e. the combined use of chemical and organic fertilizer in aman rice was enhanced the crop yield 16,17. The pest insects also damaged the yield of rice 18,19. The yield of jute has been increased by the application of 100% and 150% NPK 20 and by addition of different organic fertilizer 21. The second pre-dominant crop of West Bengal is oilseeds and contributes about 18 % of the total net sown area 15. The mustard oilseeds are cultivated in West Bengal as a winter season crop 9. The yield of mustard is directly proportional with the increase of nitrogen up to 150 kg urea ha-1 22. The sensible use of organic fertilizer, chemical fertilizer enhance the yield of mustard observed in the previous research on fertilizer use and mustard yield 23. It was also found in the previous study, that the yield of wheat has significantly increased by the application of chemical and organic fertilizer 24,25. In previous study it was found that the wheat yield losses by the reduction of pesticide use 26. After Green Revolution the pest and diseases have significantly decreases the yield rate of wheat 27. The previous research also indicate that the yield of lentil has significantly increases by increasing the organic fertilizer 28,29 and chemical fertilizer 29. The application of NPK and combination of NPK and FYM had significantly increases the yield of lentil in the previous study 30.
The present study aims to find out the impact of the use of chemical fertilizer (NPK, Urea, Potash, Mixture and DAP), organic fertilizer (cow dung manure) and pesticides (Hamla and Supper Killer) on the productivity of seven major crops and to explain the impact of pest attack on the crop yield.
The study area (Kaliyaganj C D Block) is the southernmost Block of Uttar Dinajpur District in West Bengal State (comes under the country of India) (Fig. 1) and covering a total rural area 301.93 square km (30192.91 hectares). According to census 2011 there were total 191 inhabited and 1 uninhabited mouzas (villages), accommodating a total 49745 households31. The total rural population of the C.D. Block was 224142 in which 115104 (51.35 %) was male and 109038 (48.65 %) was female31. About 81.05 % workers are directly involved in agricultural activity and due to this the agriculture is the main economic activity of the study area (census 2011)31.
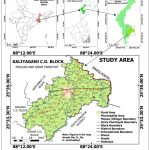 |
Figure 1: Location map of the study area. |
Materials and Methods
The input and output of seven crops in the sampling villages were collected from the department of the Bureau of Applied Economics and Statistics (BAE & S) of Uttar Dinajpur District in West Bengal. The input and output related data were collected during 2019 to 2020 cropping seasons. There were total 192 villages in the study area. Total 120 sample plots from 18 sample villages (J.L. No.) out of 192 villages were selected based on the stratified random sampling (Table 1). The data of fertilizer (chemical and organic) and pesticide were obtained in kg (kilogram) ha-1 and g (gram) ha-1 respectively (Table 2) and the production (kg) of crops were gained at the plot level by the following ‘crop cut’ method.
The crop productivity of different crops at the plot level was calculated by the equation 1. In the present research, the actual or farmer yield (FY) was taken to approach the objectives of the study instead of the potential yield (PY) and attainable yield (AY). Actual yield defined as ‘the yield, which is gained by the farmers’4. The ‘crop cut’ method was used to measure the production of different crops. In crop cut method, the productivity of the crop was measured by dividing the total crop production by the total harvested crop area in the crop cut plots32. The crop cutting plots were selected by the following stages (Fig. 2)33.
Crop Productivity or Crop Yield4 (kg ha-1) = ……………… (equation 1)
Where, P= Amount of harvested product (kilogram or kg) and C= Crop area (hectare or ha)
Table 1: Selected sample villages (J.L. No.) and Plot of the study site
|
J.L. No. |
Plot No. (Sample crops) |
J.L. No. |
Plot No. (Sample crops) |
|
5 |
147 (A), 371 (A), 179 (B), 273 (B) |
96 |
140 (A), 123 (A), 17 (J), 9 (J), 24 (B), 23 (B) |
|
6 |
132 (A), 164 (A), 453 (B), 260 (B) |
118 |
614 (A), 427 (A), 562 (B), 576 (B) |
|
23 |
223 (J), 282 (J), 202 (Mu), 237 (Mu), 232 (Ma), 238 (Ma) |
124 |
89 (A), 62 (A), 575 (B), 282 (B) |
|
27 |
57 (J), 102 (J), 504 (Mu), 150 (Mu), 147 (L), 496 (L), 248 (L), 708 (Ma), 709 (Ma), 562 (Ma) |
142 |
626 (A), 1 (A), 6 (B), 56 (B) |
|
37 |
28 (J), 386 (J), 53 (Mu), 379 (Mu), 31 (L), 47 (L), 345 (Ma), 444 (Ma) |
146 |
664 (A), 544 (A), 85 (B), 127 (B) |
|
51 |
123 (A), 38 (A), 900 (B), 901 (B) |
153 |
981 (J), 762 (Mu), 289 (Mu), 298 (W), 296 (W), 290 (W), 288 (W), 778 (L), 988 (L), 326 (Ma), 328 (Ma) |
|
74 |
129 (A), 32 (A), 22 (B), 81 (B) |
164 |
1394 (Mu), 1396 (Mu) |
|
79 |
147 (J), 273 (J), 189 (Mu), 193 (Mu), 187 (W), 168 (W), 208 (L), 209 (L), 185 (L) |
174 |
82 (J), 136 (J), 167 (Mu), 10 (Mu), 369 (L), 101 (Ma), 102 (Ma) |
|
89 |
206 (J), 94 (J), 265 (Mu), 223 (Mu), 222 (L), 139 (L), 145 (L), 115 (Ma), 206 (Ma) |
217 |
257 (J), 371 (J), 574 (Mu), 373 (Mu), 370 (W), 373 (W), 563 (W), 564 (W), 565 (W), 371 (L), 346 (L), 369 (L), 461 (Ma), 549 (Ma), 553 (Ma), 371 (Ma) |
|
91 |
138 (A), 115 (A), 262 (B), 96 (B) |
Note: J.L. No. = Jurisdiction List Number, A = Aman rice, B = Boro rice, J = Jute, Mu = Mustard, Ma = Maize, W = Wheat, L = Lentil
Correlation coefficient (r) and regression (Ŷ) analysis generally used to find out the association and the relative strength between the dependent and the independent variable respectively 34. The student ‘t’ test was used to find out the significance level of correlation 34. The correlation and regression analysis were done among the dependent variable (crop yield or ‘y’) and independent variable (fertilizer and pesticide use or ‘x’) by the used of following equation 2 and 3. In the present study the regression equation of ‘Ŷ’ on ‘x’ was the equation of the best-fitting straight line in the form of equation 3, obtained by the method of least squares34. Then we had two equations (equation 4 and 5) involving ‘a’ and ‘b’ (in equation 3), solving which the values of ‘a’ and ‘b’ were obtained.

Where, ‘x’ = Chemical fertilizer (kg ha-1), Organic fertilizer (kg ha-1) and Pesticide use (g ha-1); ‘y’ = Crop yield or productivity (kg ha-1); ‘n’ = Number of variables
Regression34 (Ŷ) = a + bx………….……. equation 3
∑ y = an + b∑ x ……..…………equation 4
∑ xy = a∑ x + b∑ x 2……………..……equation 5
Table 2: Average fertilizer (kg ha-1) and pesticide (g ha-1) were used during crops production in 2019 to 2020 Cropping Seasons.
|
Crops |
Fertilizer (kg ha-1) |
Pesticide (g ha-1) |
|||||
|
Chemical |
Organic |
||||||
|
NPK |
Urea |
Potash |
Mixture |
DAP |
Cow dung manure |
Hamla and Supper Killer |
|
|
Aman rice |
90 |
228 |
23 |
No |
No |
1200 to1500 |
1140 |
|
Jute |
109 |
68 |
No |
No |
No |
1000 to 1200 |
1000 |
|
Mustard |
195 |
75 |
No |
No |
No |
1000 to 1300 |
1300 |
|
Wheat |
156 |
66 |
No |
No |
No |
800 to 1000 |
400 |
|
Lentil |
9 |
40 |
No |
43 |
No |
800 to 1100 |
No |
|
Boro rice |
150 |
190 |
10 |
No |
No |
1000 to 1300 |
1300 |
|
Maize |
256 |
104 |
No |
No |
77 |
1500 to 2000 |
3850 |
Note: NPK = Nitrogen (N), Phosphorus (P) and Potassium (K); DAP = Di-ammonium Phosphate (Source: BAE & S, West Bengal and Field Survey by Authors)
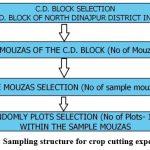 |
Figure 2: Sampling structure for crop cutting experiment33 |
Two indicators (inputs and output) were used to evaluate the input-output ratio (or cost-benefit analysis). Inputs are those resources which are used to produce the outputs. Inputs are the combination of intermediate inputs and factors of production. Seven intermediate and one factor of production inputs are consisting of the seeds, fertilizer (chemical and organic), crop protection products (pesticides, insecticides etc.), tillage, irrigation and labor. The input-output ratio of different crops was computed by equation 6.
Input-Output Ratio35 = I : O……………………equation 6
Where, ‘I’ = Input used in total single crop production process and ‘O’ = Output of single crop (both considered in volume i.e., in price INR ha-1)
Result and Discussion
Correlation and regression analysis were taken to analysis the impact of fertilizer and pesticide consumption on the productivity of crops (Table 3). The total seven crops were taken to approach the objectives of the present study. These crops were aman rice, jute, mustard, wheat, lentil, boro rice and maize. These were the most important analytical part in agriculture geography to find the crop efficiency of an area.
Aman rice
The maximum and minimum yield of aman rice was 4977.99 kg ha-1 (plot no 115) and 1420.90 kg ha-1 (plot no 32) respectively. The average yield of aman rice was about 3901 kg ha-1. The yield of 50 % plots was higher than the average yield of aman rice. The result showed that 40 % plots were high crop productivity and rest 40 % and 20 % plots were the medium and low respectively (Fig. 3). Chemical fertilizer (P < 0.01) and pesticide (P < 0.10) were significantly correlated with the yield rate of aman rice (Table 3 and Fig. 3). About 13.17 kg ha-1 crop yield of aman rice had increased to 1 kg ha-1 chemical fertilizer use, other hand 50.26 kg ha-1 crop yield increased to 100 g ha-1 pesticide use. It is also found that, 55 % plots were affected by the pests and diseases due to these the yield rate of those plots (about 3156.82 kg ha-1) was very low as compared to others 45 % unaffected plots (about 4517.24 kg ha-1).
 |
Figure 3: Effect of fertilizer (a) and (b) and pesticide use (c) on aman rice |
Jute
The average jute yield was about 13.34 bales ha-1 and it ranges from 7.26 (plot no 282) to 18.65 (plot no 82) bales ha-1. The jute yield of 41 % plots was above the average yield. It was found that 11 % and 24 % plots were very high and high crop rate of productivity and the rest 59 % and 5 % plots were medium and low respectively. Jute yield rate had a maximum correlation (P < 0.01) with organic fertilizer use (Table 3 and Fig. 4), but the correlation had not significant in the chemical fertilizer and pesticide use. It was found that, 0.001 bales (0.17 kg) ha-1 jute yield increases with the addition of 1 kg ha-1 organic fertilizer. The result also showed that, 47 % of the plots were affected by the pests and diseases, due to these the yield of those plots was
Table 3: Correlation and Regression among Fertilizers (chemical and organic), pesticide and crop yield (2019-2020)
|
Correlation and regression analysis |
Crop yield (kg ha-1) and Chemical fertilizer (kg ha-1) |
|||||||
|
Name of crops |
Seasons |
Degree of freedom |
r |
r2 |
a |
b |
Remarks |
|
|
Aman rice |
Monsoon |
16 |
0.56 |
0.31 |
1577 |
13.17 |
*** |
|
|
Jute^ |
15 |
0.17 |
0.03 |
11.94 |
0.01 |
Ns |
||
|
Mustard |
Winter |
16 |
0.62 |
0.38 |
594.9 |
2.44 |
*** |
|
|
Wheat |
9 |
0.24 |
0.06 |
1663 |
1.52 |
Ns |
||
|
Lentil |
15 |
0.37 |
0.14 |
523.5 |
2.35 |
|||
|
Boro rice |
Summer |
18 |
0.22 |
0.05 |
3241 |
4.78 |
Ns |
|
|
Maize |
15 |
0.2 |
0.04 |
1868 |
3.2 |
|||
|
Correlation and regression analysis |
Crop yield (kg ha-1) and Organic fertilizer (kg ha-1) |
|||||||
|
Name of crops |
Seasons |
Degree of freedom |
r |
r2 |
a |
b |
Remarks |
|
|
Aman rice |
Monsoon |
18 |
0.15 |
0.02 |
3610 |
0.15 |
Ns |
|
|
Jute^ |
15 |
0.64 |
0.41 |
8.04 |
0.001 |
*** |
||
|
Mustard |
Winter |
16 |
0.46 |
0.21 |
1031 |
0.26 |
*** |
|
|
Wheat |
||||||||
|
Lentil |
15 |
0.53 |
0.28 |
91.17 |
0.45 |
** |
||
|
Boro rice |
Summer |
18 |
0.77 |
0.6 |
2567 |
1 |
*** |
|
|
Maize |
||||||||
|
Correlation and regression analysis |
Crop yield (kg ha-1) and Pesticide (kg ha-1) |
|||||||
|
Name of crops |
Seasons |
Degree of freedom |
r |
r2 |
a |
b |
Remarks |
|
|
Aman rice |
Monsoon |
18 |
0.39 |
0.15 |
3196 |
502.6 |
* |
|
|
Jute^ |
15 |
0.1 |
0.01 |
13.16 |
0.56 |
Ns |
||
|
Mustard |
Winter |
16 |
0.7 |
0.49 |
-507.07 |
1509 |
*** |
|
|
Wheat |
9 |
0.62 |
0.39 |
1936 |
559.9 |
*** |
||
|
Lentil |
||||||||
|
Boro rice |
Summer |
18 |
0.73 |
0.54 |
1257 |
2327 |
*** |
|
|
Maize |
15 |
0.44 |
0.195 |
2030 |
323.4 |
* |
||
Note: *, ** and *** denote that the correlation is significant at P < 0.1, P < 0.05 and P < 0.01 respectively, ‘Ns’ denote Not significant and ^ denote jute yield express in bales ha-1.
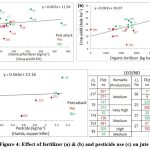 |
Figure 4: Effect of fertilizer (a) and (b) and pesticide use (c) on jute |
very low (about 11.38 bales ha-1) in comparison to the unaffected plots (about 15.07 bales ha-1).
Mustard
The maximum and minimum mustard yield of mustard was 2619.22 (plot no 379) and 862.91 (plot no 167) kg ha-1 respectively, and the average yield was 1212.29 kg ha-1. The mustard yield of 61 % plots was higher than the average yield. The result elaborated that 28 % plots showed the high mustard production and the rest 17 % and 56 % plots were produced the medium and low production respectively. Organic fertilizer did not use in 3 (17 %) plots out of 18 plots for the mustard production. The three input variables having significantly correlated (P < 0.01) with the mustard yield (Table 3 and Fig. 5). The result represents that 2.44 kg ha-1 mustard yield increases with the addition of 1 kg ha-1 chemical fertilizer.
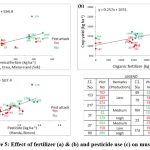 |
Figure 5: Effect of fertilizer (a) and (b) and pesticide use (c) on mustard |
The addition of 1 kg ha-1 organic fertilizer had increased the mustard yield by 0.26 kg ha-1. It was also found that, 15.09 kg ha-1 mustard yield increased by the addition of 100 g ha-1 pesticides. The result expressed that, 56 % plots were affected by the pests and diseases, due to these the yield rate of those plots (1095.05 kg ha-1) was very low as compared to others unaffected plots (1659 kg ha-1).
Wheat
The average wheat yield was about 2150 kg ha-1 and it ranges from 1496.65 (plot no 564) to 2707.02 (plot no 288) kg ha-1. The wheat yield of 64 % plots was higher than the average yield. The result investigate that the wheat productivity was ranged between medium (64 % plots) and low (36 % plots) production categories. The pesticides having a maximum correlation (P < 0.01) with the wheat yield rate in comparison to chemical fertilizer. But the pesticide did not use in the total 6 plots (54 %) out of 11 plots and 3 plots (50 %) out of 6 plots were affected by pests and diseases. The result showed that 55.99 kg ha-1 wheat yield increased by the addition of 100 g ha-1 pesticide (Table 3 and Fig. 6). It was also found that, 36 % plots were affected by the pest and diseases, due to these the yield rate of those plots (about 1721.33 kg ha-1) was very low in comparison to the unaffected plots (about 2394.84 kg ha-1).
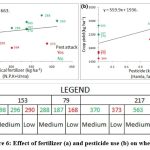 |
Figure 6: Effect of fertilizer (a) and pesticide use (b) on wheat |
Lentil
The average yield of lentil was 633.7 kg ha-1 and it’s ranges from 442.65 (plot no 147) to 1251.99 (plot no 222) kg ha-1. The lentil yield of 41 % plots was more than the average yield. The result also indicates that 12 % plots had high productivity. The rest 59 % and 27 % plots had the medium and low productivity respectively. Among the 17 plots, 4 (24 %) plots did not use the chemical fertilizer for lentil production. The lentil yield had significantly correlated with the organic fertilizer (P < 0.05) rather than the chemical fertilizer (Table 3 and Fig. 7). Results were expressed that 0.45 kg ha-1 lentil yield increased by the addition of 1 kg ha-1 organic fertilizer. It was also found that 2.35 kg ha-1 lentil yield increased by the addition of 1 kg ha-1 chemical fertilizer. It was also true that; lentil yield was decreased by the pests and diseases. About 29 % plots (465.7 kg ha-1) were affected by the pest attack and due to these the yield rate of those plots was very low as compared to other unaffected plots (726.18 kg ha-1).
Boro rice
The average boro rice yield was 4288 kg ha-1 and it ranges from 3562.04 (plot no 56) to 5594.13 kg ha-1 (plot no 85). The boro rice yield of 45 % plots was above the average yield rate. It was also observed that 30 % plots had high productivity and remaining 60 % and 10 % plots were the medium and low respectively. The boro rice yield had significantly correlated with the pesticide (P < 0.01) and organic fertilizer (P < 0.01) in comparison to the chemical fertilizer (Table 3 and Fig. 8). The results elaborated that 232.7 kg ha-1 boro rice yield increased by the addition of 100 g ha-1 pesticide. It was also found that 1 kg ha-1 boro rice yield increased by the addition of 1 kg ha-1 organic fertilizer. It was also recorded that boro rice yield had decreased by the pests and diseases. About 47 % plots (3823.44 kg ha-1) were affected by the pest attack and due to these the yield rate of those plots was very low as compared to other unaffected plots (4753.14 kg ha-1).
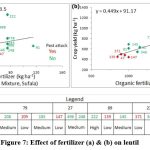 |
Figure 7: Effect of fertilizer (a) and (b) on lentil |
Maize
The average maize yield was 3277 kg ha-1 and it ranges from 1376 (plot no 345) to 5975 (plot no 238) kg ha-1. The maize yield of 59 % plots were greater than the average yield. The results showed that only 6 % plots had medium productivity and rest 94 % plots had low productivity. Maize yield was significantly correlate with the pesticide (P < 0.10) in comparison to the rest two inputs (Table 3 and Fig. 9). The result demonstrated that 32.34 kg ha-1 maize yield increased by the use of 100 g ha-1 pesticide. It was also found that, maximum maize plots were affected by the pests and diseases and as a result the yield of those plots had decreased by a maximum amount of rate. About 94 % plots (3108.74 kg ha-1) were affected by the pests and diseases, due to these the yield rate of those plots was very low as compared to other unaffected plots (5975.17 kg ha-1).
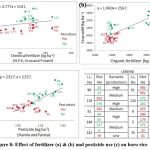 |
Figure 8: Effect of fertilizer (a) and (b) and pesticide use (c) on boro rice |
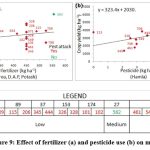 |
Figure 9: Effect of fertilizer (a) and pesticide use (b) on maize |
Input-Output or Cost-Benefit Analysis
The investigation showed that the inputs and output vary significantly across the season wise different crop cultivation (Table 4). The investment of money in labor, chemical fertilizer and tillage costs were greater than the others input in the crop production process. The production costs (or input use) were higher in the production of boro rice, jute, maize and aman rice crops than the other three crops. The input-output ratio was similar for the jute and lentil crops, but slightly lower for the wheat crop. The lowest input-output ratio was recorded in the maize and boro rice cultivation. The net output was highest for the mustard crop. The output of mustard crop was more than the double of input costs. The net output was also higher for the jute and lentil crops, i.e., almost the double of input costs. The net output of summer season crops was very low as compared to the monsoon and winter season crops.
Table 4: Input-output ratio and net benefit of crops (2019-2020)
|
Name of crops |
Season |
Inputs (INR ha-1 ) |
|||||||||
|
Intermediate inputs |
|||||||||||
|
Chemical fertilizer |
Organic fertilizer |
Irrigation |
Pesticides |
||||||||
|
NPK |
Urea |
Others* |
Total |
||||||||
|
Number of inputs parameter |
1 |
2 |
3 |
4 |
|||||||
|
Aman rice |
Monsoon |
2700 |
2285 |
391 |
5376 |
1555.7 |
533.6 |
2178.4 |
|||
|
Jute |
3270 |
680 |
0 |
3950 |
1083.2 |
3687.4 |
373.5 |
||||
|
Mustard |
Winter |
5850 |
750 |
0 |
6600 |
1240.8 |
2362.1 |
1885.2 |
|||
|
Wheat |
4680 |
630 |
0 |
5310 |
763.7 |
3158.7 |
1931.5 |
||||
|
Lentil |
270 |
400 |
731 |
1401 |
882.4 |
− |
− |
||||
|
Boro rice |
Summer |
4500 |
1900 |
68 |
6438 |
1205.9 |
13979.6 |
3084.0 |
|||
|
Maize |
7680 |
1040 |
1309 |
10029 |
3936.4 |
8701.5 |
3169.4 |
||||
|
Name of crops |
Season |
Inputs (INR ha-1 ) |
Total inputs (INR ha-1) |
Total outputs (INR ha-1) |
Input-output ratio |
Net benefit (INR ha-1) |
|||||
|
Intermediate inputs |
Factor of production |
||||||||||
|
Seeds |
Tillage |
Labour |
|||||||||
|
Number of inputs parameter |
5 |
6 |
7 |
||||||||
|
Aman rice |
Monsoon |
1139.1 |
7394.2 |
29095.9 |
47273.7 |
71198 |
1 : 1.5 |
23924.30 |
|||
|
Jute |
881.7 |
6032.4 |
33796.7 |
49441.8 |
89625 |
1 : 1.8 |
40183.19 |
||||
|
Mustard |
Winter |
989.5 |
6814.9 |
6807.8 |
26709.2 |
59604 |
1 : 2.2 |
32894.81 |
|||
|
Wheat |
3702.9 |
5910.9 |
10618.1 |
28213.3 |
41387 |
1 : 1.5 |
13173.71 |
||||
|
Lentil |
1899.5 |
5549.1 |
6805.2 |
16901.7 |
30418 |
1 : 1.8 |
13516.26 |
||||
|
Boro rice |
Summer |
2486.4 |
6722.7 |
26892.0 |
60821.6 |
78261 |
1 : 1.3 |
17439.45 |
|||
|
Maize |
8492.4 |
5560.9 |
8622.5 |
48512.1 |
57675 |
1 : 1.2 |
9162.88 |
||||
Note: * denotes Potash, DAP, Mixture, Sufala, and Zink etc. Total inputs include the six intermediate (including the chemical fertilizer, organic fertilizer, irrigation, pesticide, seeds, tillage costs) and one factor of production (labour costs i.e., who managed the crop fields by planting, weeding, harvesting etc.). The input-output ratio35 had calculated by equation 6. Net benefit35 = (Total outputs- Total inputs). (Source: Collected Data from Field Survey and Data Computed and Tabulated by Authors, 2019-2020)
Conclusion
The present research conducted on seven principal crops of the study area, where chemical fertilizer was highly correlated with the crop productivity for aman rice, mustard and lentil crops. On the other, organic fertilizer was highly correlated with the jute, boro rice, lentil and mustard crops yield. The pesticide was found to be highly correlated with the all-crop productivity except jute. So overall in all crop production processes; the productivity of the crops was highly correlated with the organic fertilizer and pesticide other than the chemical fertilizer. The investment of money in chemical fertilizer was higher than the organic fertilizer. But if we observe the impact of chemical and organic fertilizer on the crop productivity, the productivity rates are highly correlated with the organic fertilizer in most of the crops. So, the application of organic fertilizer has been found beneficial in terms of productivity as well as environmental sustainability.
Acknowledgement
I thank the Assistant director of the Bureau of Applied Economics and Statistics, Raiganj, Uttar Dinajpur, Government of West Bengal in India for providing the required data. This research would not have been possible without his invaluable suggestions and support. The author expresses deep gratitude to field supervisor Shri Bhaskar Chakraborty of the Bureau of Applied Economics and Statistics Department.
Conflict of Interest
The author declares that he has no known conflict of interest.
Funding Sources
The author received no financial support for this article.
References
- Food and Agriculture Organization. Guidelines for the measurement of productivity and efficiency in agriculture. Food Agric Organ. 2018;(October):69. doi:10.13140/RG.2.2.31566.72006
- FAO. Productivity and Efficiency Measurement in Agriculture Literature Review and Gaps Analysis.; 2017.
- OECD. Measuring Productivity. Organ Econ CO-OPERATION Dev. Published online 2001. doi:10.1787/9789264194519-en
CrossRef - Fermont A, Benson T. Estimating yield of food crops grown by smallholder farmers: A Review in the Uganda Context. IFPRI Discuss Pap 01097. 2011;(June):1-57.
http://ebrary.ifpri.org/utils/getfile/collection/p15738coll2/id/124924/filename/124925.pdf - Rosenstock TS, Rufino MC, Butterbach-Bahl K, Wollenberg E, Richards M. Methods for Measuring Greenhouse Gas Balances and Evaluating Mitigation Options in Smallholder Agriculture.; 2016. doi:10.1007/978-3-319-29794-1
CrossRef - Fischer T, Byerlee D, Edmeades G. Crop yields and global food security: will copyright Act 1968 yield increase continue to feed the world? Aust Cent Int Agric Res. Published online 2014:634.
- Show S. Cost of Cultivation and Profitability of Agriculture in West Bengal : A Study with Special Reference to Backward Region of West Bengal. Econ Aff. 2018;63(4):1067-1075. doi:10.30954/0424-2513.4.2018.33
- Bhoi PB, Wali VS, Swain DK, et al. Input use efficiency management for paddy production systems in india: A machine learning approach. Agric. 2021;11(9):1-27. doi:10.3390/agriculture11090837
CrossRef - Srivastava SK, Chand R, Singh J. Changing Crop Production Cost in India: Input Prices, Substitution and Technological Effects. Agric Econ Res Rev. 2017;30(conf):171. doi:10.5958/0974-0279.2017.00032.5
CrossRef - Alam MJ, Humphreys E, Sarkar MAR, Yadav S. Intensification and diversification increase land and water productivity and profitability of rice-based cropping systems on the High Ganges River Floodplain of Bangladesh. F Crop Res. 2017;209(April):10-26. doi:10.1016/j.fcr.2017.04.008
CrossRef - Cen Y, Guo L, Liu M, Gu X, Li C. Using organic fertilizers to increase crop yield , economic growth , and soil quality in a temperate farmland. PeerJ. 2020;8. doi:10.7717/peerj.9668
CrossRef - Liu Q, Xu H. Impact of Fertilizer on Crop Yield and C : N : P Stoichiometry in Arid and Semi-Arid Soil. Published online 2021.
CrossRef - Patra S, Mishra P, Mahapatra SC, Mithun SK. Modelling impacts of chemical fertilizer on agricultural production: a case study on Hooghly district, West Bengal, India. Model Earth Syst Environ. 2016;2(4):1-11. doi:10.1007/s40808-016-0223-6
CrossRef - Government of India. Directorate of Economics and Statistics, Ministry of Agriculture & Farmers Welfare Department of Agriculture, Cooperation & Farmers Welfare.; 2018.
- Government of India. District Wise Crop Production Statistics, National Information Centre, Ministry of Communication & IT.; 2018. https://aps.dac.gov.in/APY/Public_Report1.aspx
- Islam S, Parveen K, Khan MIK, Rahman MM, Ahmad F. Integrated use of organic manure with chemical fertilizers on the growth and yield of T. Aman rice. J Sci Technol Environ Informatics. 2016;3(1):170-177. doi:10.18801/jstei.030116.19
CrossRef - Rouf A, Khan A, Mitu AS, Rabin MH. Interaction Effect of Fertilizer and Manure on the Growth and Yield of T . Aman Rice in Different Soil. 2017;7(9):482-485.
- Ismaël S. Impact of Insect Pest on Yield of Rice: Case of Varieties Ir 46 and Nerica 3 in Agroecosysteme of Maga Far North of Cameroon. Glob J Biol Agric Heal Sci. 2017;6(2):11-29. doi:10.24105/gjbahs.6.2.1702
CrossRef - Sparks A, Nelson A, Castilla N. Where rice pests and deseases do the most damage. Rice Today. 2012;(December):26-27. http://ricetoday.irri.org/where-rice-pests-and-diseases-do-the-most-damage/
- Majumdar B, Saha AR, Ghorai KA, et al. Effect of fertilizer treatments on jute (Chorchorus olitorius), microbial dynamics in its rhizosphere and residual fertility status of soil. Indian J Agric Sci. 2014;84(4):503-508.
- Qulsum U, Meem FF, Promi RS, Zaman JR, And MFA, Rahman MK. GROWTH PERFORMANCE OF JUTE ( Corchorus capsularies L . ) AS INFLUENCED BY DIFFERENT ORGANIC MANURES. 2020;6(1):17-24.
CrossRef - Shorna SI, Polash MAS, Sakil MA, et al. Effects of nitrogenous fertilizer on growth and yield of Mustard Green. Trop Plant Res. 2020;7(1):30-36. doi:10.22271/tpr.2020.v7.i1.005
CrossRef - Banerjee A, Datta JK, Mondal NK. Impact of different combined doses of fertilizers with plant growth regulators on growth, yield attributes and yield of mustard (Brassica campestris cv. B9) under old alluvial soil of Burdwan, West Bengal, India. Front Agric China. 2010;4(3):341-351. doi:10.1007/s11703-010-1017-7
CrossRef - Abedi T, Alemzadeh A, Kazemeini SA. Effect of organic and inorganic fertilizers on grain yield and protein banding pattern of wheat. Aust J Crop Sci. 2010;4(6):384-389.
- Tehulie NS. The Effect of Organic and Inorganic Fertilizers on Growth and Yield of Bread Wheat (Triticum aestivum L.). Curr Investig Agric Curr Res. 2020;9(1):1161-1166. doi:10.32474/ciacr.2020.09.000302
CrossRef - Hossard L, Philibert A, Bertrand M, et al. Effects of halving pesticide use on wheat production. Sci Rep. 2014;4:1-7. doi:10.1038/srep04405
CrossRef - Singh RP, Singh PK, Rutkoski J, et al. Disease Impact on Wheat Yield Potential and Prospects of Genetic Control. Annu Rev Phytopathol. 2016;54(May):303-322. doi:10.1146/annurev-phyto-080615-095835
CrossRef - Zeidan M. Effect of organic manure and phosphorus fertilizers on growth, yield and quality of lentil plants in sandy soil. Res J Agric Biol Sci. 2007;3(6):748-752.
http://www.aensiweb.net/AENSIWEB/rjabs/rjabs/2007/748-752.pdf - Saket S, Singh SB, Namdeo KN, Parihar SS. EFFECT OF ORGANIC AND INORGANIC FERTILIZERS ON YIELD, QUALITY AND NUTRIENTS UPTAKE OF LENTIL. 2014;16(3):238-241.
- Fatima K, Ganie SA, Kumar Y, Masoodi TH, Shah A. Effect of Organic and Inorganic Fertilizer Doses on Growth and Yield of Lentil under Cold Arid Conditions of Ladakh. Int J Curr Microbiol Appl Sci. 2018;7(11):1449-1455. doi:10.20546/ijcmas.2018.711.167
CrossRef - Census of India. DISTRICT CENSUS HANDBOOK, UTTAR DINAJPUR, VILLAGE AND TOWN DIRECTORY.; 2011.
- Murphy J, Casley DJ, Curry JJ. Farmers’ Estimations as a Source of Production Data: Methodological Guidelines for Cereals in Africa. Vol 132.; 1991.
- Bengal G of W. Districtwise Estimates of Yield Rate and Production of Nineteen Major Crops of West Bengal during 2014-15. Bur Appl Econ Stat. Published online 2016:1-243.
- DAS NG. STATISTICAL METHODS. Combined E. McGraw Hill Education; 2018.
- Wang S, Yang L, Su M, et al. Increasing the agricultural, environmental and economic benefits of farming based on suitable crop rotations and optimum fertilizer applications. F Crop Res. 2019;240(January 2019):78-85. doi:10.1016/j.fcr.2019.06.010
CrossRef