

Introduction
Rice is a main cereal crop contributing to the world’s most caloric consumption and instant nutrition¹. Besides the yielding quantities, the determination of rice grain quality is also important because it can meet up the consumer’s demand. Rice grain quality (RGQ) includes milling, storage, cooking, eating, nutritional and market quality of rice grain. RGQ can be judged based on physical properties (size, shape, color), biochemical composition (amylose content, gelatinization temperature, viscosity, and aroma), and nutritional properties (micronutrients, protein, amino acid content). Rice is consumed in milled or polished form, subtracting most of the nutritional components. This milled rice contains only starchy endosperm having low sugar, low fat, low cholesterol, trace amount of gluten and enough portion of protein containing all eight essential amino acids which make a perfect diet food for hypertension patients advised to take salt-limited and low fiber diet². Among the carbohydrates within the rice grain, starch is most abundant and important component due to its small-sized granules and hypoallergic effects³. The most prominent endo-hydrolase enzyme within the grain is α-amylase, which helps in the rapid degradation of starch into a soluble substrate, the available form for utilization of other enzymes. Another salient source of carbohydrate is sucrose which enzymatically broken down to produce hexoses (mainly glucose) which are considered to power and support the growth of the sink tissues⁵.Starch is considered a vital reserve food in plants. Carbohydrates produced by photosynthetic tissues during the different growth stages are either transported to other organs in form of soluble sugars or accumulated in leaf tissues. It has been reported that the ability of plants to recover from most abiotic stresses normally increases with increasing concentrations of photosynthetic assimilates in plant tissues during or after stress⁴. Rice grain has a great biological value for providing energy and calories in high amount. As major constituent, carbohydrate in form of complex polysaccharides present in rice grain, and these are broken down into glucose providing the most vital energy source for human brain. Besides carbohydrates, there are some minor constituents within the starch present either at the surface or inside the granule itself. Rice starch granule contains approximately 1% of lipids and ~0.25-0.30% of proteins⁵. The present investigation was taken into account for qualitative assessment of some local rice cultivars grown under natural conditions. This precised us to investigate the eating and cooking qualities viz.amylose content, total soluble sugar, protein, free amino acid content, α-amylase activities etc in the selected local rice varieties. Statistical analysis was performed to reveal significant variance of data from biochemical analyses..
Materials and methods
Seed sample collection
Matured seeds (caryopses) of fifteen local rice cultivars viz., Amalmona (AMA), Chinigura (CHI), Dudheshwar (DUD), Gitanjali (GIT), Gobindobhog (GOB), Harinakhuri (HAR), Kalojira (KAL), Kanakchur (KAN), Kartick khas (KAR), Khas dhan (KHA), MTU-1153 (MTU), Radhunipagal (RAD), Sabita (SAB), Satabdi IET-4786 (SAT), Sukumar C (SUK) were collected from two research stations i.e., Bidhan Chandra Krishi Vishwavidyalaya, Mohanpur, Nadia, West Bengal, and Indian Council of Agricultural Research (ICAR), Dighirpar, Canning, West Bengal. The collected mature seeds were categorized into two subtypes, viz., aromatic and high-yield cultivars.
Growth condition
For biochemical assessment at seedling stage, seeds were surface sterilized with 1% sodium hypochlorite solution and imbibed in distilled water for 24 h⁶. Then germinated seedlings were raised in soil up to 14 days. Seedlings were maintained in natural conditions (Rice experimental field, University of North Bengal, attitude 26˚84′ North, longitude 88˚44′ East) ⁷at 28 ± 1˚C, 70-80% relative humidity and 12h day/night photoperiod in july 2022.
Seed sample preparation
For biochemical assessment of rice grain, first dehusking the grains from hull of both types, followed by grounding the grains into fine powder using ceramic morter-pestle⁸. Resulting fine powder stored at -20˚C till further use.
Alkali spreading value/gelatinization temperature
The gelatinization temperature is estimated based on alkali spreading value (ASV). The alkali spreading value was determined as described⁹. In short, six rice kernels of each cultivar were placed in small-sized glass Petri plates (50×42×22 mm) containing 1.7% Potassium Hydroxide (KOH) solution. Kept kernels undisturbed for 24h and then take a reading of kernels disintegration visually. The disintegration of kernels was scored as follows- Score 1: unaffected kernels, score 2: swollen kernel, score 3: swollen kernel with incomplete-narrow collar, score 4: swollen kernel with complete-wide collar, score 5:splitted kernel with complete-wide collar, score 6: dispersed kernel with merged collar, score 7: complete, intermingled dispersed kernel. Gelatinization temperature is inversely related to ASV i.e., low ASV value has corresponded to a high gelatinization temperature.
Gel consistency
Gel consistency was measured according to the method¹⁰. Briefly, take 100 mg rice flour into a culture tube (13×100 mm),then add 95% ethyl alcohol containing 0.02% thymol blue and kept them for boiling by adding 2ml of 1(N) KOH. After 8 minutes of boiling, test tubes were left at room temperature for 5 minutes and then placed in the ice bath for a few minutes. Finally, placed the tube horizontally on graph paper for measuring the spreading. GC was scored as follows- Spreading of gel <40 mm (hard), 41-60 mm. (medium), >60 mm. (soft).
Estimation of amylose by spectrophotometer
Amylose content is estimated as described by¹¹. Briefly, 100 mg grain flour was taken into a volumetric flask and add allow to digest using 9 ml of 1(N) NaOH by heating for 10 minutes in a water bath. After the gelatinization of starch kept the flask at room temperature and made up the volume of up to 100 ml of distilled water. To the 500µl of a test sample, add 5 ml distilled water, 100µl of acetic acid, and 200µl of iodine solution. A dilution was made by adding 4.2 ml of distilled water again. The absorbance of reaction mixture was taken at 620 nm. by using a spectrophotometer (Microprocessor UV-VIS Double Beam Spectrophotometer-2700). The amylose content within the test sample was estimated using pure amylose (Sigma-Aldrich, USA) standard curve.
Estimation of maltose content
The content of maltose is estimated according to the method described by ¹².Breifly,100mg sample was extracted with 80% warm alcohol and taken supernatant after centrifugation at 8000 rpm. Then evaporated the supernatant and made the volume up to 2ml. Add an equal volume of dinitro salicylic acid reagent (containing Na-K-tartrate and NaOH) to the sample extract and leave it in the water bath for 10 minutes. After cooling add 10 ml of distilled water and absorbance was taken at 520 nm. against the reagent blank. The concentration of maltose is calculated from a prepared standard curve of pure maltose (1mg/ml) purchased from Himedia.
Estimation of total soluble sugar content
The total soluble sugar content is estimated according to the procedure described ¹³with some modifications. Briefly, a 100 mg sample was boiled with 5ml 0f 2.5 (N) HCl. Then cool down at room temperature, neutralized with the solid form of sodium carbonate until effervescence ceases. Then made volume up to 50 ml and centrifuged at 10000 rpm for 10 minutes. With 1 ml of supernatant add 4 ml of ice cold anthrone reagent. Then absorbance of the reaction mixture was taken at 630 nm. against reagent blank. The concentration of total soluble sugar was estimated from a standard curve using glucose as standard soluble sugar (1mg/ml). The concentration of sugar is calculated as follows-

Estimation of reducing sugar content
The reducing sugar content was estimated using method described by ¹⁴. Briefly, 100mg sugar sample was extracted using 80% ethanol. Then centrifuged the sample and evaporated the supernatant. Volume made up to 10 ml with distilled water. Finally, the reaction mixture contained 3 ml of sugar sample and 3 ml of dinitrosalicylic acid reagent. After 5 minutes of boiling in a water bath, a reddish-orange color developed, lastly add 1 ml of sodium-potassium-tartrate to the mixture. Then absorbance of the solution was taken at 510 nm. using UV-Vis spectrophotometer. The concentration of reducing sugar is estimated from a standard curve of glucose (Himedia). Calculated as follow-

Estimation of protein content
The protein content was estimated using method described by ¹⁵with some minor modifications. In brief, 1g powder sample was subjected to extraction by 0.1 (M) Phosphate buffer (pH-7.4) for subsequent soluble protein estimation. Then centrifuged at 10000 rpm for 10 minutes and collected the supernatant. The final reaction mixture contained 1 ml of supernatant, 5 ml of solution C (mixture of sodium carbonate and copper sulphate-sodium potassium tartrate), and 500 µl of Folin-ciocalteu reagent. After 30 minutes of dark incubation, absorbance was taken at 660 nm. against blank. The concentration of protein was calculated from the standard BSA (bovine serum albumin) curve having a stock concentration 1mg/ml.
Estimation of total free amino acids
Total free amino acid content was estimated using the method described by ¹⁶.Briefly, 1g of seeds were homogenized in 80% ethanol. Centrifuged the sample and supernatant was collected. The final reaction volume contained 300 µl of sample extract and 1 ml of ethanolic ninhydrin reagent. After 30 minutes of boiling water bath incubation, a purple color was developed. The absorbance of sample was taken at 570 nm. using UV-Vis spectrophotometer.
Qualitative assay for α-amylase activity
For qualitative assessment of α-amylase activity, we used starch agar plate assay using embryo-less half seeds as described by 17. Briefly, rice seeds are surface sterilized according to method 4. And then incubated with distilled water at 28±2˚ C for 48h. after that seeds were cut transversely and placed embryo-less halfseed on 2% agar plate. The agar plate contained soluble potato starch 0.2%, and 20 mM of CaCl₂, and 20 mM of sodium succinate (pH-5.0). Petri plates were incubated at 28˚C for 48h. After the incubation period plates were flooded with KI solution, and after 5 minutes, due to the reaction between iodine starch the agar-plate turns blueish-purple except for the region of hydrolysis of starch by α-amylase producing halo-zones. The diameter of halo zones was measured using millimeter scales which corresponds to α-amylase activity.
Result and discussion
Amylose content: Amongst the samples of examined cultivars, the highest amylose content is registered in SAT, Figure 1 while the lowest in HAR (10-folds lower than SAT, following the trend-
SAT > DUD > SUK > SAB > KAL > RAD > GOB > MTU > CHI > KAN > KAR > AMA > KHA > GIT > HAR
Maltose content: The maltose content is registered to be highest in GIT Figure 1 and lowest in DUD and AMA (1.8-fold lower than AMA). The trend followed is-
GIT > KAN > SAT > SUK > KHA > KAR > MTU > HAR > GOB > KAL > SAB > CHI > RAD > DUD > AMA
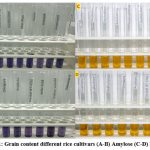 |
Figure 1: Grain content different rice cultivars (A-B) Amylose (C-D) Maltose |
Total soluble sugar: The total soluble sugar content in grain, registered to be highest in Gitanjali (GIT) and low in Kartick khas (KAR)and Amalmona (AMA) [21 folds lower than GIT], following the trend- Figure 2
GIT > SAB > RAD > CHI > DUD > KHA > MTU > SUK > HAR > SAT > GOB > KAL > KAN > KAR > AMA
Reducing sugar: Reducing sugar is registered to be the highest in grains of KALand lowest in KAR (1.7-fold lower than KAL), following trend- Figure 2
KAL > AMA > CHI > HAR > SAB > GIT > SAT > RAD > KAN > DUD > GOB > SUK > KHA > MTU > SUK
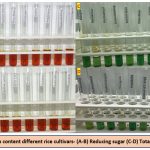 |
Figure 2: Grain content different rice cultivars- (A-B) Reducing sugar (C-D) Total soluble sugar |
Amino acid content: The grain of AMA registered the highest amount of total free amino acids, Figure 3 whereas FRAD (5.2 folds lower than AMA) showed an overall trend-
AMA > DUD > SAB > GIT > KAR > KHA > SUK > GOB > KAN > MTU > KAL > HAR > SAT > RAD > CHI
Protein content: The highest protein content is observed in DUD and the lowest in KHA (5.1 folds lower than DUD) with the overall trend-
DUD > GIT > SAB > AMA > KAN > KAL > HAR > MTU > SAT > RAD > SUK > CHI > KAR > GOB > KHA
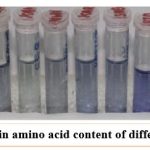 |
Figure 3: Grain amino acid content of different rice cultivar. |
Considering the grain quality of above selected cultivars, the free amino acid content is an important anti-oxidant molecule. As in cultivar Amalmona (AMA), Sabita (SAB), and Dudheshwar (DUD) higher free amino acid content is directly correlated with protein content ⁸.
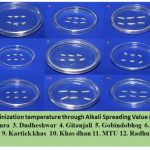 |
Figure 4: Gelatinization temperature through Alkali Spreading Values(ASV) Scale |
Alkali spreading value (ASV) is another important determinant in ECQ supported by ¹⁸. ASV is the measure of tendency to alkali digestion. This ASV is inversely related to gelatinization temperature (GT). ASV is directly related to the presence of short chain amylopectin in grain starch that means short chain amylopectin easily digests the grain under an alkali solution, Figure 4 which make its gelatinization temperature high (i.e., cooking time high) as shown by cultivar Dudheshwar (DUD) ²⁰. In cultivar Gitanjali (GIT), a lower gelatinization temperature (GT) value can be seen Figure 4, due to low amylose content, which helps to gelatinize the starch comparatively at lower temperature ³. A similar result can also be seen for cultivars Kartick khas (KAR), Khas dhan (KHA), and Amalmona (AMA).
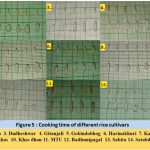 |
Figure 5: Cooking time of different rice cultivars |
Considering the eating and cooking quality (ECQ) of rice, gel consistency is an important indicator of ECQ. Gel consistency (GC) measures the cold-paste viscosity of cooked milled rice flour, an index used in distinguishing cooked rice texture of high amylose genotype ²¹. Figure 5 GC is inversely proportional to the amylose content and directly proportional to the amylopectin short chain as shown by cultivar Sabita (SAB) and Sukumar C (SUK). As amylose is known to restrict the gelatinization property of starch molecules, the high amylose containing rice viz. SAT, SUK, DUD, KAL, HAR were shown to have high GT value as well as high gel consistency. The nature of gel consistency is also get affected by amylose content ²². Upon heating, water molecules entered within the amorphous layer of a starch molecules and double-helical crystalline structures get disrupted. After that, the starch granules undergo hydration, resulting in granule swelling and subsequent solubilization ³. The amylopectin molecules are known to catalyse the starch swelling process or gelatinization whereas amylose restricts it as shown by cultivar GIT and AMA with soft gel consistency i.e., more spreading due to less amylose content ³.
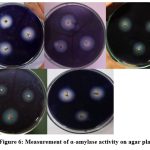 |
Figure 6: Measurement of α-amylase activity on agar plates |
If we focused on the α-amylase activity of cultivars it is directly correlated with the conversion of stored carbohydrates²³ into soluble and reducing sugar which subsequently help in seedling growth and better adaptability ⁴٫¹⁹. On other hand, maltose content is also directly related to the α-amylase activity Figure 6, as α-amylase hydrolyses the polysaccharide starch ⁴.
Table 1: Result of biochemical assessment of 15 different rice grains
|
Cultivar |
Amylose content(%) |
Maltose content (%) |
Total soluble sugar (%) |
Reducing sugar (%) |
Protein content (%) |
Amino acid (%) |
|
KAL |
21.0 |
0.021 |
1.01 |
3.21 |
0.16 |
1.3 |
|
KAN |
18.0 |
0.031 |
0.95 |
2.38 |
0.26 |
1.47 |
|
HAR |
2.8 |
0.022 |
1.71 |
2.83 |
0.23 |
1.28 |
|
GOB |
19.8 |
0.021 |
1.2 |
2.34 |
0.18 |
1.95 |
|
KAR |
13.0 |
0.025 |
0.94 |
1.86 |
0.07 |
3.12 |
|
KHA |
8.2 |
0.026 |
5.12 |
2.27 |
0.08 |
2.85 |
|
SAB |
22.0 |
0.02 |
10.74 |
2.55 |
0.19 |
4.12 |
|
GIT |
7.1` |
0.032 |
19.78 |
2.52 |
0.5 |
3.92 |
|
AMA |
9.9 |
0.017 |
0.93 |
3.05 |
0.3 |
5.13 |
|
DUD |
23.6 |
0.018 |
6.7 |
2.34 |
0.31 |
4.21 |
|
RAD |
20.2 |
0.019 |
10.01 |
2.44 |
0.1 |
0.65 |
|
CHI |
18.5 |
0.02 |
7.31 |
2.97 |
0.07 |
0.53 |
|
SAT |
28.4 |
0.03 |
1.46 |
2.44 |
0.12 |
0.97 |
|
MTU |
18.3 |
0.023 |
3.18 |
2.13 |
0.18 |
1.33 |
|
SUK |
22.9 |
0.027 |
2.23 |
2.29 |
0.09 |
3.35 |
Table 2: Results of physico-chemical properties of 15 different rice grains
|
Cultivars |
Gel consistency |
Nature of consistency |
Alkali spreading value (ASV) |
Gelatinization temperature (GT) |
50% cooking time (min.) |
α-amylase activity zone(cm.) |
|
KAL |
76 |
SOFT |
2 |
7 |
11 |
0.97 |
|
KAN |
75 |
SOFT |
5 |
5 |
8 |
0.86 |
|
HAR |
35 |
HARD |
1 |
7 |
10 |
1.29 |
|
GOB |
30 |
HARD |
1 |
7 |
19 |
0.98 |
|
KAR |
55 |
MEDIUM |
3 |
5 |
9 |
0.84 |
|
KHA |
53 |
MEDIUM |
3 |
5 |
7 |
1.81 |
|
SAB |
83 |
SOFT |
3 |
5 |
10 |
2.63 |
|
GIT |
41 |
MEDIUM |
3 |
5 |
9 |
1.89 |
|
AMA |
79 |
HARD |
3 |
5 |
8 |
0.84 |
|
DUD |
35 |
HARD |
1 |
7 |
10 |
1.92 |
|
RAD |
98 |
SOFT |
2 |
7 |
12 |
2.17 |
|
CHI |
45 |
MEDIUM |
1 |
7 |
15 |
2.08 |
|
SAT |
93 |
SOFT |
2 |
7 |
11 |
1.24 |
|
MTU |
52 |
MEDIUM |
2 |
7 |
18 |
1.76 |
|
SUK |
115 |
SOFT |
1 |
7 |
9 |
1.67 |
Currently, the above-mentioned varieties are cultivated only in some specific regions within west Bengal. The knowledge achieved from our above studies with help the farmers as well as the consumers to be aware of taking nutritionally improved rice for their proper nourishment.
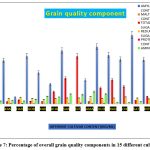 |
Figure 7: Percentage of overall grain quality components in 15 different cultivars |
Statistical analysis
Two-way Analysis of Variance (ANOVA) without replication was performed using Microsoft excel Software XLSTAT version 2021.1 (alpha input range- 0.5)
Table 3: Two-way ANOVA for biochemical components in 15 different cultivars
|
Anova: Two-Factor Without Replication |
|||||||
|
CULTIVARS |
Count |
Sum |
Average |
Variance |
|||
|
KAL |
6 |
985.98 |
164.33 |
15570.31 |
|||
|
KAN |
6 |
890.47 |
148.4117 |
11105.89 |
|||
|
HAR |
6 |
762.34 |
127.0567 |
12601.47 |
|||
|
GOB |
6 |
661.55 |
110.2583 |
7649.996 |
|||
|
KAR |
6 |
759.5 |
126.5833 |
12585.77 |
|||
|
KHA |
6 |
915.85 |
152.6417 |
13937.9 |
|||
|
SAB |
6 |
2187.87 |
364.645 |
111609.9 |
|||
|
GIT |
6 |
2042.15 |
340.3583 |
150679.8 |
|||
|
AMA |
6 |
1257.24 |
209.54 |
38437.25 |
|||
|
DUD |
6 |
1336.36 |
222.7267 |
29707.17 |
|||
|
RAD |
6 |
1121.93 |
186.9883 |
31507.68 |
|||
|
CHI |
6 |
885.94 |
147.6567 |
21958.01 |
|||
|
SAT |
6 |
831.5 |
138.5833 |
11430.82 |
|||
|
MTU |
6 |
795.65 |
132.6083 |
5535.586 |
|||
|
SUK |
6 |
923.14 |
153.8567 |
10159.64 |
|||
|
AMYLOSE CONTENT (%) |
15 |
2034.19 |
135.6127 |
7050.351 |
|||
|
MALTOSE CONTENT (%) |
15 |
34.02 |
2.268 |
0.157203 |
|||
|
TOTAL SOLUBLE SUGAR (%) |
15 |
4193.31 |
279.554 |
112164.5 |
|||
|
REDUCING SUGAR (%) |
15 |
3761.25 |
250.75 |
1319.393 |
|||
|
PROTEIN CONTENT (%) |
15 |
2787.5 |
185.8333 |
10237.38 |
|||
|
AMINO ACID CONTENT (%) |
15 |
3547.2 |
236.48 |
21474.28 |
|||
|
ANOVA |
|||||||
|
Source of Variation |
SS |
df |
MS |
F |
P-value |
F crit |
Significance test |
|
Rows |
484275.8 |
14 |
34591.13 |
1.470024 |
0.145738 |
0.961979 |
Factor is significant |
|
Columns |
775216.7 |
5 |
155043.3 |
6.588899 |
4.45E-05 |
0.878747 |
Factor is significant |
|
Error |
1647169 |
70 |
23530.99 |
||||
|
Total |
2906662 |
89 |
Conclusion
Amylose content was high in Satabdi IET-4786 (28%) and lowest observed in Harinakhuri. Alpha amylase activity was high in Sabita (2.63 cm) and lowest in Kartickkhas (0.89 cm). In our study, we provided some vital information regarding the morpho-physiological depictions of local farmer’s varieties. This will help plant breeders and rice researchers in near future for developing better, quality varieties.
Acknowledgements
Financial assistance is provided by the combined Council of Scientific and Industrial Research (CSIR)- University Grants Commission (UGC) National Fellowship scheme JRF. The authors also like to thank Bidhan Chandra Krishi Viswa Vidyalaya (BCKV) and Indian Council of Agricultural Research (ICAR) Canning, West Bengal for providing the seeds used in above mentioned study. Thank you to Dr. Kriti Ghatani, Department of food technology, University of North Bengal, for providing UV-Vis Double beam spectrophotometer facility.
Conflict of interest
The authors declare that there is no conflict of interest in publishing research work.
References
- Das, P., Adak, S., Majumder, A.L. (2020). Genetic Manipulation for Improved Nutritional Quality in Rice. Frontiers in Genetics. 2020; 11:776; 1-6
CrossRef - Lavanya A., Pinky, B. (2019). Physical and Nutritional Quality Evaluation of Different Rice Varieties. Int.J.Curr.Microbiol.App.Sci (2019) 8(6) 1827-1834
CrossRef - Wani, A.A., Singh, P., Shah, M. A., Schweiggert-Weisz, U., Gul, K., Wani, A. (2012). Rice Starch Diversity: Effects on Structural, Morphological, Thermal and Physicochemical Properties- A Review. Comprehensive Reviews in food science and food safety;11: 417- 419
CrossRef - Das, P., Seal, P., Biswas, A.K. (2016). Regulation of Growth, Antioxidants and Sugar Metabolism in Rice (Oryza sativa L.) Seedlings by NaCl and Its Reversal by Silicon. American Journal of Plant Sciences; (2016): 7: 623-638
CrossRef - Ghosh, P., Roychoudhury, A. (2020). Nutrition and antioxidant profiling in the unpolished and polished grains of eleven indigenous aromatic rice cultivars. Biotech Spinger;10.548; 1-8
CrossRef - Kumar, R.G., Shah, K., Dubey, R.S. (2000). Salinity induced behavioural changes in malate dehydrogenase and glutamate dehydrogenase activities in rice seedlings of differing salt tolerance. Plant Science:156; 23-34
CrossRef - Roy, S.C., Sharma, B.D. (2014). Assessment of genetic diversity in rice [Oryza sativa L.] germplasm based on agro-morphology traits and zinc-iron content for crop improvement. Physiol Mol Biol Plants;20(2): 209-224
CrossRef - Aiyswaraya, S., Saraswathi, R., Ramchander, S., Vinoth, R., Uma, D., Sudhakar, D., Robin, S. (2017). An Insight into Total Soluble Proteins across Rice (Oryza sativa) Germplasm Accessions. Int.J. Curr.Microbiol. App.Sci: 6(12): 2254-2269
CrossRef - Little, R.R., Hilder, G.B, Dawson, E.H. (1958). Differential effect of dilute alkali on 25 varieties of milled white rice. Cereal Chem:35: 111-126
- Cagampang, G.B., Perez, C.M., Juliano, B.O. (1973). A gel consistency test for eating quality of rice. J Sci Food Agric.: 24 (12): 1589-1594
CrossRef - Juliano, B.O. (1971). A simplified assay for milled rice amylose. Cereal Sci Today:16:334-338
- Jayaraman, J. (1981). Laboratory Manual in Biochemistry, Wiley Eastern Ltd. (1981) p. 54
- Hedge, J.E., Hofreiter, B.T. (1962).Carbohydrate Chemistry. Academic Press: 17
- Miller, G.L (1972). Use of dinitrosalicylic acid reagent for determination of reducing sugar. Anal. Chem. 31: 426
CrossRef - Hartree, E.A. (1972). Determination of Protein: A Modification of the Lowry Method That Gives a Linear Photometric Response. Ana. Bio Chem. 48, 422-427
CrossRef - Moore, S. (1965). Amino acid analysis: Aqueous dimethyl sulfoxide as solvent for the ninhydrin reaction. Jour. of Biol. Chem., 23: 243
CrossRef - Liu, L., Xia, W., Li, H., Zeng, H., Wei, B., Han, S., Yin, C. (2018). Salinity Inhibits Rice seed Germination by Reducing α-Amylase Activity via Decreased Bioactive Gibberellin Content. Front. plant Sci. 9:275
CrossRef - Sreenivasulu, N., Zhang, C., Tiozon, R.N., Liu, Q. (2022). Post-genomics revolution in the design of premium quality rice in a high-yielding background to meet consumer demands in 21st Plant Comm.; Cellpress: 3:100271
CrossRef - Stanley, D., Farnden, K.J.F., Macrae, E.A. (2005). Plant α-amylase: functions and roles in carbohydrate metabolism. Bio; Bratislava: Suppl. 16: 65-71
- Chemutai, L.R., Musyoki, M.A., Kioko, W.F., Mwenda, N.S., Muriira, K.G., Piero (2016). Physicochemical Characterization of Selected Rice (Oryza Sativa) Genotypes Based on Gel Consistency and Alkali Digestion. Biochem. Anal. Biochem. Vol 5: 1000285
CrossRef - Sultana, S., Faruque, M., Islam, M.D. (2022). Rice grain quality parameters and determination tools: a review on the current developments and future prospects.Int. J. Food Prop.25, 1063-1078. https://doi.org/10.1080/10942912.2022.2071295
CrossRef - Panja, S., Kar, R.K., Dey, P.C., Dey, N. (2022). Underpinning the soft nature of soak-n-eat rice- A physicochemical molecular approach. Food Sci.2212-4292. https://doi.org/10.1016/j.fbio.2022.102122
CrossRef - Guzman, M.K., Parween, S., Butardo, V.M., Alhambra, C.M (2017). Investigating glycemic potential of rice by unraveling compositional variations in maturwe grain and starch mobilization patterns during seed germination. Sci. Rep.7:5854.DOI:10.1038/s41598-017-06026-0
CrossRef