
Introduction
Mulberry (Morus alba L.; Moraceae) believed to be a native of either India or China is a robust, perennial deep-rooted high biomass producing proteinaceous foliage and fast growing deciduousperennial plant, widely distributed in tropical,sub-tropical and temperate regions.1Besides being the sole food source for the mulberry silkworm, (Bombyx mori) mulberry is honoured as ‘Kalpavriksha’ because of its multipurpose uses like fodder for cattle; leaves in poultry ration; fruits are consumed raw, or made into juices, jam and wine; mulberry wood used for furniture, sports goods; and pruned branches serve as a major fuel resource in most of the sericulture areas.2 Mulberry growth rests on the genetic potential, management practices and balanced nutrition of the plant. Stress has been laid towards increased quality and quantity of mulberry leaves due to the increased demand in production of quality silk. Incessant usage of chemical fertilizers deteriorate soil health, and loss of plant nutrients which results in wide spread deficiencies of macro and micronutrients.3Regrettably,the onus is only on major nutrients with no attention on micronutrients, which play a key role in balanced nutrition.4 Micronutrients embroil in numerous metabolic actions accountable for synthesis of protein, sugar and enzyme leading to superior quality of mulberry production. Enhancement in mulberry excellence with foliar application of micronutrients have been reported.5-6 Hence, when deprived of micronutrients, physiological disorders occur leading to mulberry of low quality and yield.7 Soil application of micronutrients in adequate amount, and in proper proportion governs mulberry development growth, and yield in quality and quantity. Since available literature on this mentioned aspect is scanty, the present investigation was taken up to analyse the effect of soil application of micronutrients on the growth and yield of mulberry plants [MR2 (Mildew Resistant Variety2)].
Materials and Methods
Experimental site
A three year old mulberry garden, free from other plants which received direct sunlight exposure with proper irrigation served for conducting field experiments. This experimental plot was situated at an altitude of 29m above sea level at Poovan code village, Kanyakumari district, Tamil Nadu, India (8.3031° N, 77.2881° E).
Climatic conditions
Data on climatic parameters viz., temperature, relative humidity, rainfall and light intensity during the study period (January 2018 to December 2018) were obtained from the meteorological observatory, Nagercoil, Kanyakumari, Tamil Nadu, India.
Soil analysis
Soil tests were performed to estimate the type and amount of nutrients available to plants which aid in determining fertilizer needs. The soil samples were collected at random from the top soil (0-30cm depth) with the aid of a stainless steel spade before the start of the experiment and a composite sample was prepared. The collected soil sample was placed in a clean container and foreign particles like stones, pebbles, gravels and roots were removed, and transported to laboratory, where they were air dried, powdered and allowed to pass through 2mm mesh and was determined for significant physicochemical properties.8 Methods employed for determination of the soil properties are presented in Table 1. Post-harvest analysis of soil was performed wherein control and micronutrient treated soil samples were collected and tested for nitrogen, phosphorus and potassium as per the procedure outlined by Jackson8, Rowell9and Piper10.The micronutrients, viz., zinc, iron and copper content were estimated by diethylenetriaminepentaacetic acid (DTPA) solvent extraction method11 using Atomic Absorption Spectrophotometer (AAS).
Table 1: Physicochemical properties of soil in the experimental site
|
Parameters |
Unit |
Method |
Before treatment |
After treatment (Pruning) |
|
|
45thday |
60thday |
||||
|
Texture |
– |
Hydrometer |
Sandy loam |
Sandy loam |
Sandy loam |
|
pH |
– |
Systronic digital pH meter |
8.65 |
6.48 |
6.21 |
|
Electrical conductivity |
dSm-1 |
Conductivity meter |
0.03 |
0.33 |
0.30 |
|
Nitrogen |
Kg/ha |
KelplusDistyl – EMS |
195.0 |
175.0 |
98.0 |
|
Phosphorous |
Colorimeter |
25.5 |
19.0 |
13.7 |
|
|
Potassium |
Flame photometer |
225.5 |
201.0 |
216.0 |
|
|
Copper |
ppm |
Atomic absorption spectrophotometer |
1.36 |
1.18 |
1.03 |
|
Iron |
12.37 |
7.01 |
6.58 |
||
|
Zinc |
3.15 |
0.98 |
0.79 |
||
Mulberry cultivation
For the experimental study, MR2 (Mildew Resistant Variety 2) mulberry plant (Morusalba) was selected. This was developed by the Sericulture Department, Govt. of Tamil Nadu experimental station, Coonor, Tamil Nadu, India. The mulberry plants were pruned in the month of June, ploughed, FYM applied at 20t/ha/year, and a single dose of nitrogen, phosphorous and potash at 120:120:60kg/ha/year was hoed in the soil uniformly. All of the above were done prior to the commencement of the experiment. Irrigation at an interval of five day was provided, depending upon the climatic conditions. After twenty days of pruning, the micronutrients were added to the soil. Care was taken to ensure that the experimental plot was protected from plant pests and also in periodical removal of diseased/affected parts of the plant.
Experimental design and treatments
A randomized block design with twelve treatments with spacing of 90x60cm between the plants was chosen for the field experiments. Recommended dose of fertilizers and the macronutrients, viz., nitrogen, phosphorous and potassium (NPK) in the form of ammonium sulphate, super phosphate, potash (120:120:60) was common for all treatments. Each treatment (except control) was supplemented with the required amount of micronutrients, viz., zinc, copper and iron in the form of zinc sulphate, copper sulphate and ferrous sulphate either individually or in combination (Table 1) and were given as soil application. Each treatment replicated thrice, with ten plants per replication was supplemented with the required amount of micronutrients.
Table 2: Treatments used for the present study
|
Treatment |
Micronutrients (individual/combination) |
|||||
|
T0 |
: |
Control |
||||
|
T1 |
: |
FeSO4 10Kg/ha |
||||
|
T2 |
: |
Zn SO4 5Kg/ha |
||||
|
T3 |
: |
CuSO4 5Kg/ha |
||||
|
T4 |
: |
CuSO4 5Kg/ha |
+ |
ZnSO4 5Kg/ha |
||
|
T5 |
: |
CuSO4 5Kg/ha |
+ |
FeSO4 10Kg/ha |
||
|
T6 |
: |
FeSO4 10Kg/ha |
+ |
ZnSO4 5Kg/ha |
||
|
T7 |
: |
CuSO4 5Kg/ha |
+ |
ZnSO4 5Kg/ha |
+ |
FeSO4 10Kg/ha |
|
T8 |
: |
CuSO4 10Kg/ha |
+ |
ZnSO4 10Kg/ha |
+ |
FeSO4 20Kg/ha |
|
T9 |
: |
CuSO4 15Kg/ha |
+ |
ZnSO4 15Kg/ha |
+ |
FeSO4 30Kg/ha |
|
T10 |
: |
CuSO4 20Kg/ha |
+ |
ZnSO4 20Kg/ha |
+ |
FeSO4 40Kg/ha |
|
T11 |
: |
CuSO4 25Kg/ha |
+ |
ZnSO4 25Kg/ha |
+ |
FeSO4 25Kg/ha |
Five plants in each replication were randomly selected and labelled for recording observations at the 45th and 60th day of pruning for its morphometrics and characteristics, viz., plant height, shoot length, number of branches per plant, number of leaves per plant, leaf yield, and leaf area.
Statistical analysis
Pooled data affirmed as Mean ±S.D, and subjected to Student’s ‘t’ test to determine significant difference between control and treatment groups.
Results
During the study period, monthly mean maximum and minimum temperature ranged from 27.4 oC (December) to 31.2 oC (April), and from 23.9 oC (February) to 27.1 oC (April), respectively. The mean relative humidity was high in September (81.8%) and low in March (41.0%). A total rainfall of 154.7 mm was recorded, with its peak in the month of January. The mean light intensity was high in July (61800 Lux) and low in December (32000 Lux) (Figure 1). Soil was of sandy loam type, and its physicochemical properties on the 45th day of pruning was low when compared prior to treatment, and it further decreased on the 60th day of pruning(Table 1).Increased nitrogen (2.81% and 3.46%), phosphorous (0.39% and 0.41%),potassium (2.58% and 2.69%), and micronutrients, zinc (98.72ppm and 99.14ppm), copper (18.00ppm and 18.64ppm), and iron (176.50ppm and176.77ppm)content was observed in T9when compared with control on the 45th and 60th day of pruning respectively (Table 2).
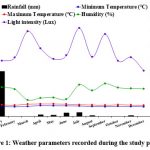 |
Figure 1: Weather parameters recorded during the study period. |
Plant height and shoot length
Soil application of micronutrients in the soil had a noteworthy influence on plant height and shoot length at 45th and 60th day of pruning. On 45th day of pruning, T9 (122.33 ±7.13cm) recorded the maximum height which increased by 22.33% over control, while T3 (103.00 ±9.20cm) recorded the minimum which increased by 3.0% over control. On 60th day of pruning, maximum plant height was observed in T10 (169.00 ±6.48cm) which increased by 25.8% over control, and minimum in T3 (138.66 ±1.69cm) which increased by 3.22% over control (Table 3; Figure 1). On the 45th and 60th day of pruning, T8 (102.32 ±10.80cm) and T9 (147.0 ±6.48cm) recorded maximum shoot length which increased by 26.32% and 30.86%,respectively over control; while their respective minimum length was noted in T3 (85.0 ±9.20cm and 116.66 ±1.69cm) which increased by 4.93% and 3.85% over control (Table 3; Figure 2).
Branches and leaves per plant
No major difference in the number of branches per plant was noticed between treatments on 45th and 60th day of pruning. T9 (11.33 ±2.86 and 11.66 ±2.49) recorded maximum number of branches which increased by 41.62% and 45.75%,respectively over control on 45th and 60th day of pruning, while a minimum of 8.0 ±0.0 branches was noted in T5 which was in par with the control on 45th and 60th day of pruning (Table 3; Figure 2). T9 (139.12 ±1.11 and 212.10 ±1.18) recorded maximum number of leaves which increased by 27.9% and 31.42%,respectively over control on 45th and 60th day of pruning, while the minimum was observed in T3 (110.66 ±5.02 and 179.14 ±1.62) which increased by 1.74% and 10.99% over control (Table 3; Figure 2).
Leaf yield
Leaf yield per plant was highly significant among the different treatments. One hundred leaf yield and the leaf yield/plant was maximum in T9 (210.90±24.78g/plant and 402.80 ±20.12g/plant) which increased by 118.91% and 136.74%,respectively over control on 45th day of pruning; and (266.9 ±28.0g/plant and 487.44 ±39.32g/plant) which increased by 70.71% and 91.07%,respectively over control on 60th day of pruning (Table 4; Figure 2). Minimum 100leaf yield was observed in T5 (142.05±17.45g/plant and 203.62 ±30.78g/plant) which increased by 47.44% and 30.24%,respectively over control on 45th day of pruning, and the minimum leaf yield/plant in T4 (269.78±8.20g/plant and 354.61 ±32.41g/plant) which increased by 58.56% and 39.02%,respectively over control on 60th day of pruning (Table 4; Figure 2).
Leaf area
Soil application of micronutrients had a noteworthy influence on the leaf area of mulberry on 45th and 60th day of pruning. On both the 45th and 60th day of pruning, the leaf area of the middle leaf was greater than apical and bottom leaves in all the treatments. Maximum leaf area on 45th and 60th day was recorded in T9 (116.18 ±52.49cm2and 121.86 ±27.14cm2) which increased by 60.59% and 25.39%,respectively over control, while minimum leaf area was noted in T1 (86.43 ±50.16cm2) which increased by 18.0% over control, and in T8 (98.036 ±41.66cm2) which increased by 0.87% respectively over control on 45th and 60th day of pruning (Table 5; Figure 2).
Table 3: Level of NPK and micronutrient contents on different treatments
|
Treatment |
Nitrogen (%) |
Phosphorous (%) |
Potassium (%) |
Zinc (ppm) |
Copper (ppm) |
Iron (ppm) |
||||||
|
45th day |
60th day |
45th day |
60th day |
45th day |
60th day |
45th day |
60th day |
45th day |
60th day |
45th day |
60th day |
|
|
T0 |
2.38 |
2.50 |
0.31 |
0.32 |
2.31 |
2.38 |
94.67 |
94.69 |
16.07 |
16.10 |
155.40 |
155.40 |
|
T1 |
2.45 |
2.89 |
0.31 |
0.33 |
2.43 |
2.47 |
95.11 |
96.01 |
16.20 |
16.79 |
171.80 |
172.50 |
|
T2 |
2.51 |
3.01 |
0.28 |
0.31 |
2.57 |
2.63 |
99.75 |
99.87 |
16.80 |
17.06 |
154.23 |
154.91 |
|
T3 |
2.57 |
3.01 |
0.37 |
0.39 |
2.42 |
2.48 |
95.20 |
95.70 |
17.10 |
17.60 |
155.76 |
156.02 |
|
T4 |
2.48 |
3.00 |
0.26 |
0.30 |
2.50 |
2.59 |
98.57 |
98.59 |
17.21 |
17.96 |
155.30 |
155.90 |
|
T5 |
2.64 |
3.14 |
0.34 |
0.32 |
2.39 |
2.44 |
94.88 |
95.25 |
17.24 |
17.98 |
167.83 |
167.90 |
|
T6 |
2.45 |
2.98 |
0.35 |
0.35 |
2.47 |
2.53 |
98.1 |
99.12 |
15.90 |
16.04 |
171.20 |
171.80 |
|
T7 |
2.41 |
3.00 |
0.34 |
0.36 |
2.38 |
2.47 |
97.98 |
98.04 |
17.90 |
18.60 |
170.56 |
171.03 |
|
T8 |
2.55 |
3.12 |
0.35 |
0.35 |
2.51 |
2.50 |
98.26 |
98.80 |
17.40 |
17.79 |
171.47 |
171.86 |
|
T9 |
2.81 |
3.46 |
0.39 |
0.41 |
2.58 |
2.69 |
98.72 |
99.14 |
18.00 |
18.46 |
176.50 |
176.77 |
|
T10 |
2.37 |
2.83 |
0.33 |
0.35 |
2.49 |
2.53 |
99.15 |
99.95 |
17.90 |
18.40 |
174.33 |
174.82 |
|
T11 |
2.40 |
3.07 |
0.29 |
0.32 |
2.39 |
2.45 |
97.78 |
98.07 |
17.32 |
17.93 |
173.81 |
174.04 |
Table 4: Effect of soil application of micronutrients on the morphometrics of mulberry
|
Treatment |
Plant height (Values in cm) |
Shoot length (Values in cm) |
No. of branches per plant |
No. of leaves per plant |
||||
|
45th day |
60th day |
45th day |
60th day |
45th day |
60th day |
45th day |
60th day |
|
|
T0 |
100.00 |
134.33 ±2.86 |
81.0 |
112.33 |
8.0 |
8.0 |
108.76 |
161.39 |
|
T1 |
109.00 |
143.00 ±6.97 |
88.0 |
121.0 |
8.66 |
8.66 ±0.81 |
120.04 |
184.22 |
|
T2 |
112.33 |
143.66 ±5.90 |
94.33 |
121.66 |
8.66 |
8.66 ±0.81 |
123.12 |
196.78 |
|
T3 |
103.00 |
138.66 ±1.69 |
85.0 |
116.66 |
8.66 ±0.47 |
8.66 ±0.81 |
110.66 |
179.14 |
|
T4 |
118.00 |
144.66 ±4.64 |
94.0 |
122.66 |
8.66 ±0.47 |
9.0 ±0.0* |
114.71 |
186.74 ±1.01* |
|
T5 |
112.66 |
154.66 ±14.70* |
90.66 ±17.91* |
132.66 ±14.70* |
8.0 ±0.0 |
8.0 ±0.0 |
124.56 |
182.05 |
|
T6 |
110.66 |
147.33 ±13.88 |
87.66 ±11.02 |
125.33 ±13.88* |
10.0 ±1.41* |
10.33 ±1.24* |
137.27 ±1.48* |
204.32 ±0.89* |
|
T7 |
110.66 |
156.66 ±7.58* |
86.69 ± 5.43 |
134.66 ±7.58* |
9.0 ±0.81* |
9.33 ±0.94* |
127.39 ±1.94* |
192.74 ±1.12* |
|
T8 |
115.33 |
157.00 ±10.61* |
102.32 ±10.80* |
129.33 ±9.80* |
9.0 ±0.81* |
9.33 ±1.24* |
119.12 ±0.91 |
197.16 ±2.13* |
|
T9 |
122.33 |
151.33 ±9.80* |
95.37 ±8.73* |
147.0 |
11.33 ±2.86* |
11.66 ±2.49* |
139.12 ±1.11* |
212.10 ±1.18* |
|
T10 |
119.00 |
169.00 ±6.48* |
96.33 ±7.13* |
135.0 ±10.65* |
10.0 ±0.81* |
10.66 ±0.94* |
132.45 ±2.84* |
195.46 ±0.42* |
|
T11 |
114.33 |
158.33 ±6.18* |
91.33 |
136.33 |
8.33 ±1.24 |
8.33 ±1.69 |
125.72 |
203.87 |
*Significant @ P<0.05 (t-test)
Table 5. Effect of soil application of micronutrients on the characteristics of mulberry
|
Treatment |
100 leaf yield |
Leaf yield/plant |
||
|
45th day |
60th day |
45th day |
60th day |
|
|
T0 |
96.34±26.34 |
156.34±30.0 |
170.14±20.0 |
255.10±22.48 |
|
T1 |
153.14±13.21* |
210.42±28.64* |
307.55±31.8* |
392.77±38.61* |
|
T2 |
157.53±29.58* |
212.61±27.54* |
281.03±27.36* |
366.94±34.96* |
|
T3 |
152.21±32.41* |
218.94±33.36* |
299.12±20.51* |
384.26±37.57* |
|
T4 |
148.87±27.12 |
206.06±28.59 |
269.78±8.20* |
354.61±32.41* |
|
T5 |
142.05±17.45 |
203.62±30.78 |
282.23±11.11* |
367.46±28.61* |
|
T6 |
188.81±27.90* |
248.46±29.82* |
336.86±28.68* |
421.83±14.49* |
|
T7 |
176.56±12.34* |
231.08±27.26* |
319.15±31.0* |
404.12±29.47* |
|
T8 |
184.39±15.87* |
240.05±27.83* |
342.14±22.6* |
427.11±36.48* |
|
T9 |
210.90±24.78* |
266.90±28.0* |
402.80±20.12* |
487.44±39.32* |
|
T10 |
169.42±21.37* |
238.84±34.71* |
313.46±37.43* |
398.55±17.54* |
|
T11 |
167.56±30.66* |
227.10±29.77* |
324.16±14.81* |
384.27±30.05* |
Values in g/plant; *Significant @ P<0.05 (t-test)
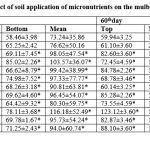 |
Table 6: Effect of soil application of micronutrients on the mulberry leaf area |
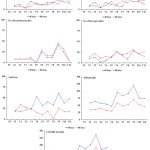 |
Figure 2: Effect of micronutrients on the growth and yield and mulberry plants. |
Discussion
Mulberry leaf composition, quality and quantity, and growthhinge onseveral features viz., mulberry variety, season, rainfall, irrigation, in addition to, temperature, duration of sunshine hours, soil profile, fertilizers, pruning, and leaf maturity and harvesting method.12 Geometry of planting or spacing is also an essential factor that decides the plant density which influences leaf quality and quantity. Shinde et al.13 revealed that distance and spacing of mulberry plants had an impact on its quality and productivity, which was taken care in the present study with spacing of 90x60cmbetween the plants. Pruning of mulberry at desired height also forms an important aspect of mulberry cultivation for production of quality leaves. Studies have reported that enhanced plant growth and better leaf yield were observed due to high crown (pruning) height.14-16Above all, soil health, environmental conditions, and micronutrient management influence the quality of mulberry leaf.17 Hence, for sustainable leaf production and refurbishment ofsoil health, soil application of balanced micronutrients is a requisite.18
Climatic factors
Temperature ranging between 23 °C and 30 °C is required for mulberry growth, with optimum temperature of 33 °C– 37 °C (maximum) and 12 °C – 13 °C (minimum) for seed germination. Rainfall is the foremost source of soil moisture, and slow gentle showers soaks into the soil, which increases high percentage of water to compensate the water lost as run off. The greater the quantity of water falling during any one rainy period, the more its inks below the reach of surface desiccation. Mulberry requires an average rainfall of over 800mm per annum, nevertheless in the present study, a total of 154 mm of rainfall was recorded. Relative humidity should be 70%-75% for proper mulberry growth.19Atmospheric moisture, the imperceptible water vapour in the air, expressed as relative humidity was at 81.8% in the present study. Further, temperature factor regulates relative humidity, as warm air can hold more water than cold air. The mean light intensity was high in July (61800Lux) and low in December (32000 Lux) with a mean value of 45283.33 Lux.
Soil factor
Soil testing approach before fertilizer application establish a proper balance of nutrients and eliminate nutrient deficiency in soil. The fertility of soil, in general, plays the key role in the development of any crop plant so also the mulberryplant,20 especially on the nutrient grade of the leaf and constant leaf produce.1Clayey loam sandy soils are required for proper mulberry growth, and in the present study, the soil type was sandy loam. The moisture content of soil is a vital feature that governs plant growth. Soil moisture content of 50-60% (in weight) is the most suitable for full growth of mulberry.19The maximum volume of capillary or hygroscopic water a particular soil can hold are principally set on soil particle type and size, in addition to organic matter, as sand, silt, clay, soil texture, and soil particlecoarse ness and fineness play a vital role. Healthy mulberry growth is observed on well-drained soils, with anaverage of 50mm of water once in 10 days for loamy soils. Mulberry growth is greatly affected by soil temperature too because extreme high and low temperatures can kill the plant,19 hencea temperature between 23°C and 30°C is necessary. In moist soils, germination and growth are governed by temperature, as it is the governing factor which impacts root growth, rate of nutrients and water uptake, which furthers ways leaf development, expansion and subsequently its yield. Soil pH is the supreme soil factor that affects the availability of nutrients in the plants. Effect of pH on the plant is dogged by the plant’s root morphology. Slightly acidic soils of pH 6.2-6.8 are ideal for qualitymulberrygrowth.19,21 Landon22 and Daji23 reported that low pH values increase the availability of micronutrients. In the present study, pH of the experimental plot before treatment was 8.65 (alkaline) which can obstruct the nutrient uptake by plants. In order to reduce the pH of the soil and favour the nutrient uptake through roots, gypsum was added to the experimental soil. On the 45thday of pruning, pH was 6.48 which was further reduced to 6.21 on the 60thday of pruning. An optimum level of low pH (6.2-6.8) favours nutrient uptake in the soil, and makes them more readily available to mulberry plants, besides increasing the microbial population in the soil.24,25 The same trend was witnessed in this study too. Pandiaraj et al.26 stated that when electrical conductivity of soil is less than 1dSm-1, it is indicative that the soil is free from salinity, and the same was observed in the present study too.
NPK
Nitrogen content determines the quality of mulberry foliage.27Increased nitrogen availability in soil due to NPK fertilizers, and by the synergetic effect of beneficial soil microorganisms, besides, organic manures enhances nitrogen content. Amongst NPK, nitrogen is the focal plant nutrient that has a crucial part in plant metabolism and growth. Nitrogen, chief component of chlorophyll, amino acids, and nucleic acids, and a component of plant proteins, nucleic acids, and vitamins influences the yield and quality mulberry leaves.28,29
Phosphorus is necessary for photosynthesis, protein synthesis, cell division, development of new tissue for growth and metabolism in plants,30 and for complex energy transformations like ATP.31 Singhvi et al.32 and Gowda et al.33 reported that the application of seriboost to mulberry increased the phosphorus content in leaf. Increased phosphorus content in the present study may due to the available phosphorus in addition to the effect of micronutrients which enhances the capillary action of the plant during transport of nutrient from soil to plants. Further, enhanced nitrogen and phosphorus contents of leaf may also be due to increased availability of nitrogen and phosphorus in soil from nitrogen fixing biofertilizer, Azospirillum brasilanse, and phosphorus solubilizing fungus, Aspergillus awamori which release phosphorus,and are absorbed to plant system and translocated to leaves.34
Potassium is indispensable for synthesis of sugars, starches, carbohydrates, proteins and in cell division,30 and involved in translocation of carbohydrates, protein metabolism, and fungal pathogen tolerance in mulberry.31 Potassium play a regulatory role in enhanced leaf quality and productivity, because they move into the guard cells around the stomata’s, wherein cells accumulate water and swell, causing the pores to open and exchange carbon dioxide, water vapour, and oxygen with the atmosphere.35 High potassium content of mulberry leaf are due to availability of adequate potassium in soil and also through application of micronutrients. Further, high nitrogen content in leaves ,enhances the potassium content, because nitrogen possess synergistic effect with potassium content of leaves,36 and the present study correlated the same.
Micronutrients
Micronutrients like zinc, iron, manganese, copper, boron, molybdenum and chloride play a central role in enzymatic reactions which govern the growth, development and yield of mulberry, 27 and hence are required in trace quantities. Mulberry requires zinc in the form of zinc divalent cations for its better growth, and for biosynthesis of plant hormones and enzymes.37 This study revealed that mulberry plants retorted well to micronutrients, and its application contributed positive effects. The level of zinc, copper and iron in the mulberry leaves at the 60thday of pruning increased when compared to 45thday. The accumulation of micronutrients in all the treated mulberry leaves may be attributable to the high rooting ability of MR2 variety, low pH of soil, irrigation, and moisture content in the soil, which made the micronutrients in the soil along with water through the capillary action, to reach the leaves, and involve in physiological functions.
Morphometrics and characteristics of mulberry
Mulberry leaf yield and quality gradually reduce because of incessant production for a long time,38 which depends on soil type, plant variety, and availability of plant nutrients and agro-ecological conditions. Integrated nutrient management increasesthe yield and quality ofmulberry39 with reference to shoot length, number of shoots and leaves per plant. This can be attributed to the role of micronutrients which in turn increased the nutrient uptake in mulberry.40Increasedshoot length might be due to the involvement of micronutrients in chlorophyll formation, which influence the physiological activity of plants, like cell division, meristematic activity in apical tissue, expansion of cell and formation of cell wall.5,41,42 Moreover, enhanced leaf and shoot yield, and fresh weight and dry matter content of leaves due to higher level of zincaided in better uptake of nitrogen,can indirectly lead to better yields.43Micronutrientsincreases mulberryleaf yield,41,44 and has a positive influence on its growth parameters.45 The upsurge in leaf yield was due to enhanced photosynthetic rate, which resulted in high accumulation of carbohydrates in thevegetative portion of the plant, and ultimately enhanced leaf growth and yield. Leaf area and leaf yield in the present study increased by 6.59% and 136.74% respectively at 45thday of pruning,and 25.39% and 91.07% respectively at 60thday of pruning in T9.This may bedue to the genetic makeup and the influence of zinc along with other micronutrients which might have helped in elongation of cell membrane, and in other physiological processes, besides, higher plant height, and more number of shoots and leaves per plant. High leaf yield can be achieved when the mulberry leaves are treated with micronutrients besides nitrogen fixing and phosphorus solubilizing bioinoculants.46Iron and zinc enhances increases the leaf yield of mulberry to the maximum by 53.2% over control,41and zinc has recorded maximum leaf yield,in plant height andshoot length, number of shoots/plant, and leaf area,44 and the same was noticed in the present study too.
Conclusion
Studies of this sort are essential and need of the hour, as they form the base work for the rearing of silkworm by enriched leaves and its effect on the rearing parameters and biochemical content of the silkworm. The present investigation emphasized that micronutrients influenced, increased and improved the growth and yield of mulberry plants. Further research should becarried out to support the present findings in regard to the physiological parameters of mulberry plant which are the sole source of nutrition to silkworm to obtain silk qualitatively and quantitatively.
Acknowledgment
The authors are thankful to the Department of Zoology, Scott Christian College, Nagercoil, Tamil Nadu, India for the help and support rendered.
Conflict of Interest
The authors declare no conflict of interest.
Funding Sources
The authors received no financial support for this research.
References
- Chandrakala, Sadatulla F. Effect of soil application of zinc, iron and manganese on V1 mulberry and total performance of cross breed PM×CSR2 (Bombyx mori L.). Journal of Entomology and Zoology Studies.2020; 8(2):712-716.
- Sujathamma P., Savithri G., Kumari N.V., Krishna V.A., Vijaya T., Sairam K.V.S.S., Reddy N.S. Effect of organic manures on quantitative and qualitative parameters of mulberry production. HortFlora Research Spectrum.2014; 3(1):14-20.
- Krishna M., Bongale U.D. Role of organic manure on growth and quality of mulberry leaf and cocoons. Indian Silk.2001; 40:11-12.
- Singh M.V., Behra S.K. Micro andsecondary-nutrient deficiencies problems inIndian soils and their amelioration throughbalanced fertilization. Extended Summaries:National Seminar on micro and secondarynutrients for balanced fertilization and foodsecurity. Indian Institute of Soil Science, Bhopal, India.2008, 3-10.
- Lokanath R., Shivashankar K. Effect of foliar application of micronutrients and magnesium on the growth, yield and quality of mulberry (Morusalba L.). Indian Journal of Sericulture.1986; 25(1):1-5.
- YeasminT., Absar N., Sarker A.A. Effect of foliar spray of micronutrients and urea on the nutritional quality of mulberry (Morus sp.) leaves. Indian Journal of Sericulture.1995; 34(2):149-152.
- Babu T.M., Madhusudhan K.V., Reddy B.A., Naik S.T. Studies on the leaf nutrition value in different mulberry (Morusalba L.) cultivars. Indian Journal of Advances in Chemical Science.2019; 7(4):130-133.
- Jackson M.L. Soil chemical analysis. Prentice hall ofIndia (Pvt) Ltd., New Delhi. 1973, 259-260.
- Rowell D.L. Soil science. Methods and application.Longman Scientific & Technical, UK.1994.
- Piper C.S. Soil and plant analysis. Hans publishers, Bombay, India. 1996.
- Lindsay W.L., Norvell W.A. Development of aD.T.P.A test for Zn, Fe, Mn and Cu. Soil Science Society of America Journal.1978; 42:421-428.
CrossRef - Krishnaswami S., Naomani M.K.R., Ahsan M.M. Studieson the quality of mulberry leaves and silkworm cocoon cropproduction. Part 1: Quality differences due to varieties.Indian Journal of Sericulture.1970; 9: 1-10.
- ShindeK.S.,AvhadS.B.,Hiware C.J. Impact of spacing’s and fertilizer’s on the production of M5 mulberry variety. International Journal of Interdisciplinary and Multidisciplinary Studies.2014; 1:344-348.
- Katsuochiyamma. Studies on the function of the root of mulberry plant in relation to shoot pruning at harvesting. Bulletin of the Sericultural Experiment Station.1970; 24(1):124-132.
- Iwata E. Studies on the growth of regenerated shoot after intermediate pruning and its application to cultivation of mulberry trees. Bulletin of the Sericultural Experiment Station.1981; 28:293-298.
- Choudhury P.C., Shukla P., Ghosh A., Mallikarjuna B., Sengupta K. Effect of spacing, crown height and method of pruning on mulberry leaf yield, quality and cocoon yield. Indian Journal of Sericulture.1991; 30(1):46-53.
- Kar R., Ram R.L., Ghosh M.K., Trivedi K. Response of mulberry (Morusalba L.) to foliar supplementation of nutrient-composite. International Journal of Agriculture Innovations and Research.2017; 6(3):582-586.
- Yadav V.K., Padhan D., Sobhana V., Sen S., Josepha M., Santha P.C.,Kariyappa, Chandrashekar M.N., Kumar K.P.,Tewary P. Effect of organic vis-à-vis conventional cultivation practices on growthand yield of mulberry (Morusalba L.). Chemical Science Review and Letters.2020; 9(34):571-577.
CrossRef - Tuigong D.R., Kipkurgat T.K.,Madara D.S. Mulberry and silk production in Kenya. Journal of Textile Science & Engineering.2015; 5:6.
- Ramachandra Y.L., Rai S.P., Sudeep H.V., Ganapathy P.S.S., Krishnamurthy N.B. Evaluation of soil fertility and mulberry leaf quality on silkworm rearingand cocoon characteristics. Asian Journal of Bio Science.2008; 3(2):295-300.
- Ahmed F., Islam M.S., Iqbal M.T. Biochar amendment improves soil fertility and productivity of mulberry plant. Eurasian Journal of Soil Science.2017; 6(3):226-237.
CrossRef - Landon J.R. Booker Tropical Soil Manual. A handbook for soil survey and agricultural land evaluation in the tropics and subtropics. John Wiley and Sons, New York.1991, 474.
- 23.Daji J.A. A text book of soil science. Media promoters and publishers, Bombay, India. 1996.
- Bates T.E. Factors affecting critical nutrient concentration in plants and theirevaluation. Soil Science.1971; 11(2):116-126.
CrossRef - Pillai S.V., Jolly M.S. An evaluation on the quality of mulberry varieties raised under hill conditions and the crop results of Bombyxmori L. Indian Journal of Sericulture.1985; 24(2):48-52.
- Pandiaraj T., Das S., KarP.K., Manjappa, Bajpeyi C.M. An extensive soil survey on plant micronutrients status in tasar silkworm host plants growing sites inMayurbhanj district of Odisha state. International Journal of Ecology and Environmental Sciences.2020; 2(3):174-177.
- Shankar M.A.Handbook of mulberry nutrition. Shetty, GP. Publications. Multiplex, Karnataka Agro Chemicals.Bangalore, India. 1997, 19-75.
- Shankar M.A., Rangaswamy B.T. Effect of applied nitrogen and potassium on mulberry leaf yield and quality in relation to silkworm cocoon characters. Better Crops International.1999; 13(2):20-21.
- Singhal B.K., Chakraborthi S., Mala V.R., Sarkar A., Datta R.K. Photosynthesis for crop improvement on mulberry(Morus sp.). Sericologia.2000; 40:27-55.
- Weyers J.D.B., Paterson N.W. Plant hormones and the control of physiological processes. New Phytologist.2001;152(3):375-407.
CrossRef - Mahadeva A. Nutritive elemental status in mulberry (Morus sp.) foliage under jassids(Empoascaflavescenes F.) infestation. Indian Journal of Natural Sciences.2016; 7(38):11537-11544.
- Singhvi N.R., Sarkar A., Datta R.K. Effect of seri-boost on the mulberry leaf yield and some commercial characters of silkworm, Bombyxmori L. Proceedings of the National Conference on Strategic Sericulture Research and Development.CSRTI, Mysore. 2000, 59.
- Gowda R., Sundar P., Raghu, B.V. Foliar spray of seribooston mulberry and its impact on cocoon production. Proceedings of the National Seminar on Tropical Sericulture.2000; 99(2):163-167.
- Shashidhar K.R., Narayanaswamy T.K., Sudhakar S.N., Bhaskar R.N.Impact of different sources of organic nutrients on chemical compositionof S-36 mulberry and soil under irrigated condition. International Journal of Current Microbiology and Applied Sciences.2018; 7(1):2233-2238.
CrossRef - Shree M.P., Kumar P.K. Effect of giant African snail AchatinafulicaBowdich infestation on the nutritionalquality of mulberry (Morus sp.) leaves. Bulletin of Indian Academy of Sericulture.2002; 6(1):50-56.
- Shankar M.A., Shivashankar H. Micronutrient status ofS54 mulberry as influenced by organic manures and fertilizerslevels. Mysore Journal of Agricultural Sciences.1994; 28:64-68.
- Thakkar P.N., Randhawa N.S.Micronutrients in Indian agriculture. Fertilizer News.1978; 23:8-26.
- Rashmi K., Shankar M.A., Shashidhar K.R., Narayanaswamy T.K. Growth and foliar constituents of mulberry (M5) cultivated under organic based nutrient management. International Journal of Industrial Entomology.2009; 19(1):165-169.
- Setua G.C., Das N.K., Banerjee, Sengupta N.D., SudhakarT., Sen P.S., Saratchandra B. Effect of integrated nutrient management on quality leaf production in mulberry (Morusalba) under rainfed, alluvial soil conditions. Indian Journal of Agricultural Science.2005; 75:474-478.
- Ray D., Gupta B.K. Effect of micronutrients on the yield and chemical composition of mulberry leaf. Annual Report, Central Sericultural Research and Training Institute, Berhampore, 1974, 81-82.
- Bose P.C., Singhvi N.R., Dutta R.K. Effect of micronutrients on yield and yieldattributes of mulberry (Morusalba L.).Indian Journal of Agronomy.1994; 39:97-99.
- Mishra A.K., Das B.K., Ansan M.M. Growth and yield of mulberry(Morus alba) as influenced by a commercial plant growth regulator.Sericologia.1995; 35(4):691-697.
- 43.Kasiviswanathan K., Iyengar M.N.S. Preliminary observations on varietal-cum-irrigational response to different levels of N on the seasonal and total yield of mulberry leaf. Indian Journal of Sericulture.1965; 4(4):32-33.
- Bose P.C., Bindroo B.B. Effect of micronutrients on yield of mulberry in sub-tropical region. Journal of Crop and Weed.2009; 5(2):142-143.
- Malakouti M.J. The effect of micronutrients in ensuring efficient use of macronutrients. Turkish Journal of Agriculture and Forestry.2008; 32:215-220.
- Woktole S., Bhaskar R.N. Responses of fresh yield and quality varieties of M5 mulberry to bioinoculants, farmyard manure (FYM) and in organic fertilizers under rain-fed conditions. African Journal of Plant Science.2013; 7(4):131-136.
CrossRef