
Introduction
The gender inequality of labour workforce in agriculture is a common phenomenon. Since the family is the major source of supply of agricultural labour, especially in the form of female labour, it contributes significantly to agriculture1. Rural women are the major stakeholders in rural development, agriculture and allied activities are the key to this development in India. Agriculture in South Asia employs 60% of working women and about 80% of rural working women of India are engaged and depend on it for their livelihood3,4 . The participation of women in agricultural labour in developing countries is 43%5, while in India; it is around 47% 20. This share of women in the field of agricultural labourers has increased over the past few decades6,7,8,9,10,11.
Many of the rural female workers (65%) are engaged in agriculture. Nearly every third cultivator and every second agricultural laborer is women (Census of India, 2011). According to NSSO female participation in agricultural activities (principal) increased from 76.6 in 1993-00 to 84.5 in 1999-00. Later, it declined to 74.5% in 2011-12 (NSSO, 2012). According to the Census of India, this share increased from 23.9 % in 1961 to 50.35% in 2001. If we consider farming and other agricultural activities, then in 1961, 79.6% of rural women were found engaged in these activities, which increased to 91.86% in 2011.
Although women’s participation in agricultural activities is substantial, gender plays a decisive role in determining who has to do what work in agriculture, who will have rights over which resources and who will take decisions12. Some factors like work experience, access to credit, access to market13,14 , irrigable land holding size15, are having significant positive association with female participation in agriculture. While the factors like size of land16, poor access to inputs, relative lack of education and heavy burden of unpaid domestic work17, time spent on domestic activities, sex of the household headship, distance from water source, mobility constraints15 have significant negative relationship with women’s participation. Apart from these factors yearly sequence of planting, spatial arrangement of crops18,19 purchasing power earned by family20,21 social groups, age22, level of education17,5,23,24 , distance of farmland 25,26 , location and density of habitat 27 are also there that determines the level of participation of females in agriculture. Women are mainly working in labour intensive activities like weeding, harvesting post harvesting processing26,28 and managing dairy animals29,30 and poultry31,32,33. In some agricultural activities, the participation of women is very high and that of men is negligible1. As the growing share of female in many activities is pointing towards feminization of agriculture and rural workplace34,35.
The agrarian economy of Uttar Pradesh is having low female participation, however almost 85% female workers are engaged in farming and associated activities36. Participation ratio is not uniform in all parts of the state and it is affected by several socio-cultural-economic and cropping factors. Factors affecting the female participation are literacy, social class, age22,37,38 and holding, income level39, cropping pattern40,41,42. The development level of the region13,25,43 is also considered a significant factor affecting the female participation in rural agriculture of Uttar Pradesh (UP).
In this way, it is clear that women participation in UP’s agriculture is on a large scale and many social, economic and cultural factors are affecting the pattern of their participation. In this study an attempt has been made to identify and analyze the pattern of female participation and also found the various factors affecting their participation in agriculture of rural Uttar Pradesh.
Material and Methodology
National sample survey data of employment & unemployment series (68th round; 2012)29 has been used in this study. Female participation in various agricultural activities has been measured. Following methods has been used for fulfillment of objectives of the study-
Proportion Measurement
Share of samples in various categories is estimated through proportion measurement. The percentage of female participation in various operations was found. For this, the required proportion data table was prepared by processing the data through the STATA 14 software. The percentage of male and female participation in agricultural activities was worked out. Along with this, the participation of women engaged in agriculture according to different social groups was also known. The proportion of female participation in different categories was also determined according to their literacy level, age, land holding and household size & household types.
Linear Regression Post-Estimation Plots
For identifying the association between Operations and Socio-Economic Variables a linear regression post-estimate plot method is used. It is an independent variable plot in form of a graph of the residuals against a specified independent variable. Hence this graph shows relationship between the dependent and independent variables while holding all variables constant. The slope of added variable plot indicates the amount of influence of independent variable of dependent variable. Through this method quantitative level of association is identified for given socio-economic factors of female participants. STATA 14 software is used to estimate the linear regression post-estimate plots by using Avplots command.
For these estimation independent variables like Social group, Age, Household Type, Household Size, Education Level and Size of Land has been taken into consideration. Number of female participating in operations of agriculture is considered as dependent variable here.
Kaiser-Meyer-Olkin (KMO) measure of sampling adequacy
This method is used to measuring the adequacy of sample for factor analysis like PCA etc. It takes values between 0 to 1. Small value indicates unsuitability of data for such analysis.
The equation of KMO is as follow (https://www.statisticshowto.com)
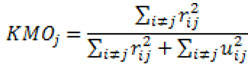
Where
r= is the correlation matrix,
u= is the partial covariance matrix,
Σ = summation notation (“add up”).
Here value less than 0.5 is considered as unfit sample size for factor analysis. KMO above 0.5 is considered suitable for PCA here
Principal Component Analysis
PCA is an unsupervised machine learning algorithms across a variety of applications. It is a dimensionality reduction method that is used to reduce the dimensionality of large data sets. PCA also used for exploratory data analysis, information compression and data de-noising. In order to calculate Principal components, It follows a set of operation such as data standardization, covariance matrix and eigenvalues & eigenvectors calculation. This method is used to identify key variables affecting the female participation in different operations. STATA 14 software is used for estimation of PCA here.
Results and Discussion
Female Participation Scenario
Women’s participation in agriculture is seen in almost every activity, although the percentage of its participation is different in different activities. It has been observed that women are engaged in those agricultural operations that requires less physical labour and more drudgery12. Agriculture land preparation is mainly done by male244,45. In case of Uttar Pradesh (NSSO 68th round), female participation in various agricultural operations is just 17%. Participation share above average is observed in Animal Husbandry (72%), Plantation (25%), Harvesting (24%), weeding (22%), transplanting (19%) and sowing (18%). The nature of these activities is that they require less muscular power. On other hand female participation is found below average in ploughing (5%), non-manual work in cultivation (8%), manual work in non-agricultural activities (8%) and other agricultural activities (12%). The participation of male is above 80 % is there in Ploughing (95%), sowing (82%), transplanting (81%), etc (Table 1).
The participation of female across various social groups is following a particular trend. Female participation as agricultural laborer is high in lower caste46 that indicates lower the caste and higher the participation47. According to NSSO 68th round data, the women participation in various agricultural operations in Uttar Pradesh is also following the same scenario as this ratio is 3.1% for general category, 6.26 for Other Backward Castes and 6.6% for SC category. Of the total female category involved in various agriculture operations, 54% belong to the OBC, 27% to the SC, 15% to the general and 3.6% comes from Scheduled Tribes category (Table 2). In case of schedule caste, the female participation is quite high in plantation (53.33%), transplanting (31.45%) and harvesting (30.65%) and low in ploughing (7.6%), while it is lowest in ploughing (7.6%). The participation of OBC female is the highest in land preparation related activities. It is above 70% in ploughing and sowing operations. In comparison of other categories, OBC female participation is highest in animal husbandry also while it is lowest in plantation (4.9%).The participation of female of general category is observed highest in plantation (41.7%) and ploughing (17.6%) while it is lowest in weeding (3.9%) and sowing (4.6%). See Table 2.
Age is another major determinant factor for female participation in agriculture. Women who belong to younger age groups are relatively engaged in agriculture48. In a study Sudh Narayanan and Sharada Srinivasan (2020)49 revealed that 89% of young age group women in India who households are engaged in cultivation have described agriculture as their main or subsidiary occupation. According to the 68 rounds of NSSO, even in Uttar Pradesh, women participation in agricultural activities is the highest in the young age group. 41% females are belongs to 30 to 44 years age group. This participation ratio is having an increasing trend from 01-14 to 30-44 years age groups, later declining to older age groups (Table 3). It is also observed that participation of females of 0-14 age group is negligible in farm preparation activities and animal husbandry. Some involvement of this class is being seen in activities like weeding, harvesting, fisheries, forestry. On other hand older age group of female (above 74 years) is having significant involvement in animal husbandry only. Overall the involvement of middle aged female in agriculture is highest here (41%) (Table 3) also revealed the same findings in a study.
The household size is also important for the availability of female members for farm work. The majority female participant’s household size is larger than the non participants14.On other hand it has also been found that large family size has chances of more male worker availability in family resultant in squeezing of labor ratio50. It is also clear in this study that female participation is increasing from small to medium-sized households, after which it has declined sharply. Almost half female participants are coming from families having size 3 to 6 persons; thereafter it’s slightly increased from toward lager family (Table 4). Larger families (9-10 members) are having comparatively better female participation in labor intensive operations like weeding, harvesting and animal husbandry that mostly done at nearby residential place only (Table 4).
Table 1: Male and Female participation in Agriculture (in %).
|
Operations |
Operation code |
Male |
Female |
All |
|
Ploughing |
1 |
94.74 |
5.26 |
100.00 |
|
Sowing |
2 |
81.99 |
18.01 |
100.00 |
|
Transplanting |
3 |
81.05 |
18.95 |
100.00 |
|
Weeding |
4 |
78.19 |
21.81 |
100.00 |
|
Harvesting |
5 |
75.36 |
24.64 |
100.00 |
|
Other cultivation activities |
6 |
85.94 |
14.06 |
100.00 |
|
Forestry |
7 |
100.00 |
0.00 |
100.00 |
|
Plantation |
8 |
74.29 |
25.71 |
100.00 |
|
Animal Husbandry |
10 |
27.94 |
72.06 |
100.00 |
|
Fisheries |
11 |
100.00 |
0.00 |
100.00 |
|
Other Agricultural Activities |
12 |
88.49 |
11.51 |
100.00 |
|
Manual work in non-agricultural activities |
13 |
91.80 |
8.20 |
100.00 |
|
Non-manual work in cultivation |
14 |
92.04 |
7.96 |
100.00 |
|
Activities other than cultivation |
15 |
89.18 |
10.82 |
100.00 |
|
All |
82.93 |
17.07 |
100.00 |
Table 2: Gender wise participation in agricultural activities among social groups.
|
ST |
SC |
OBC |
GEN |
Total |
||||||
|
Operations |
Male |
Female |
Male |
Female |
Male |
Female |
Male |
Female |
Male |
Female |
|
Ploughing |
0.62 |
0 |
17.28 |
7.64 |
45.68 |
74.74 |
36.42 |
17.62 |
100.00 |
100.00 |
|
Sowing |
0.45 |
0 |
18.83 |
16.25 |
56.05 |
79.14 |
24.66 |
4.61 |
100.00 |
100.00 |
|
Transplanting |
1.95 |
0 |
22.73 |
31.45 |
53.90 |
56.34 |
21.43 |
12.21 |
100.00 |
100.00 |
|
Weeding |
1.65 |
0 |
13.95 |
29.70 |
63.83 |
66.39 |
20.57 |
3.91 |
100.00 |
100.00 |
|
Harvesting |
0.90 |
0.96 |
16.57 |
30.65 |
59.30 |
57.39 |
23.22 |
11 |
100.00 |
100.00 |
|
Other cultivation activities |
0.58 |
0.12 |
17.65 |
26.54 |
55.28 |
59.10 |
26.48 |
14.24 |
100.00 |
100.00 |
|
Forestry |
0.00 |
0.00 |
100.00 |
0.00 |
100.00 |
|||||
|
Plantation |
0.00 |
0 |
15.38 |
53.33 |
61.54 |
4.91 |
23.08 |
41.76 |
100.00 |
100.00 |
|
Animal Husbandry |
2.63 |
0 |
17.76 |
21.35 |
60.53 |
68.99 |
19.08 |
9.66 |
100.00 |
100.00 |
|
Fisheries |
0.00 |
0.00 |
100.00 |
0.00 |
100.00 |
|||||
|
Other Agricultural Activities |
0.00 |
0 |
26.42 |
23.72 |
52.85 |
69.38 |
20.73 |
6.9 |
100.00 |
100.00 |
|
Manual work in non-agricultural activities |
1.37 |
0.82 |
32.92 |
39.12 |
53.58 |
43.01 |
12.12 |
17.05 |
100.00 |
100.00 |
|
Non-manual work in cultivation |
0.96 |
40.39 |
2.88 |
19.23 |
67.31 |
17.53 |
28.85 |
22.85 |
100.00 |
100.00 |
|
Activities other than cultivation |
1.05 |
1.09 |
22.18 |
24.24 |
52.70 |
52.60 |
24.08 |
22.07 |
100.00 |
100.00 |
|
All |
0.87 |
3.62 |
16.04 |
26.94 |
63.04 |
54.13 |
20.05 |
15.32 |
100.00 |
100.00 |
Table 3: women participation among age groups.
|
OPERATION |
Age Groups |
||||||||||
|
01-14 |
15-29 |
30-44 |
45-59 |
60-74 |
Above 74 |
Total |
|||||
|
Ploughing |
0 |
11.11 |
66.67 |
11.11 |
11.11 |
0 |
100 |
||||
|
Sowing |
0 |
30.61 |
32.65 |
28.57 |
8.16 |
0 |
100 |
||||
|
Transplanting |
0 |
13.89 |
36.11 |
38.89 |
11.11 |
0 |
100 |
||||
|
Weeding |
2.54 |
11.86 |
40.68 |
33.05 |
11.86 |
0 |
100 |
||||
|
Harvesting |
2.76 |
20.34 |
41.03 |
26.9 |
8.97 |
0 |
100 |
||||
|
Other cultivation activities |
1.57 |
17.32 |
44.88 |
28.35 |
7.87 |
0 |
100 |
||||
|
Forestry |
11.11 |
11.11 |
55.56 |
22.22 |
0 |
0 |
100 |
||||
|
Plantation |
0.26 |
25.26 |
38.01 |
25.26 |
10.97 |
0.26 |
100 |
||||
|
Animal Husbandry |
0 |
12.5 |
31.25 |
28.13 |
21.88 |
6.25 |
100 |
||||
|
Fisheries |
5.49 |
28.57 |
39.56 |
16.48 |
9.34 |
0.55 |
100 |
||||
|
Other Agricultural Activities |
0 |
0 |
44.44 |
33.33 |
22.22 |
0 |
100 |
||||
|
Manual work in non-agricultural activities |
4.12 |
29.63 |
44.44 |
16.05 |
5.35 |
0.41 |
100 |
||||
|
Total |
2.28 |
22.55 |
40.91 |
24.65 |
9.3 |
0.31 |
100 |
||||
Table 4: Women participation and family size
|
OPERATIONS |
Family Size |
||||||
|
1-2 |
3-4 |
5-6 |
7-8 |
9-10 |
Above 10 |
Total |
|
|
Ploughing |
0 |
33.33 |
22.22 |
11.11 |
33.33 |
0 |
100 |
|
Sowing |
6.12 |
24.49 |
26.53 |
6.12 |
10.2 |
26.53 |
100 |
|
Transplanting |
5.56 |
5.56 |
41.67 |
22.22 |
13.89 |
11.11 |
100 |
|
Weeding |
6.78 |
23.73 |
34.75 |
6.78 |
16.1 |
11.86 |
100 |
|
Harvesting |
5.52 |
15.86 |
32.76 |
13.79 |
13.45 |
18.62 |
100 |
|
Other cultivation activities |
10.63 |
21.26 |
33.46 |
10.63 |
8.27 |
15.75 |
100 |
|
Forestry |
0 |
11.11 |
33.33 |
22.22 |
11.11 |
22.22 |
100 |
|
Plantation |
5.36 |
17.09 |
36.73 |
11.48 |
11.99 |
17.35 |
100 |
|
Animal Husbandry |
9.38 |
37.5 |
15.63 |
15.63 |
21.88 |
0 |
100 |
|
Fisheries |
7.14 |
23.63 |
23.63 |
9.34 |
23.63 |
12.64 |
100 |
|
Other Agricultural Activities |
0 |
22.22 |
44.44 |
11.11 |
11.11 |
11.11 |
100 |
|
Manual work in non-agricultural activities |
6.58 |
19.34 |
34.57 |
11.52 |
12.76 |
15.23 |
100 |
|
Total |
6.72 |
19.53 |
32.9 |
11.4 |
13.68 |
15.77 |
100 |
Table 5: Household types via female participation
|
OPERATIONS |
Self-employed in agriculture |
Self-employed in non-agriculture |
Regular wage/salary earning |
Casual labour in agriculture |
Casual labour in non-agriculture |
Others |
Total |
|
Ploughing |
33.33 |
11.11 |
0 |
22.22 |
33.33 |
0 |
100 |
|
Sowing |
59.18 |
14.29 |
2.04 |
6.12 |
18.37 |
0 |
100 |
|
Transplanting |
55.56 |
16.67 |
0 |
8.33 |
19.44 |
0 |
100 |
|
Weeding |
58.47 |
7.63 |
7.63 |
11.86 |
14.41 |
0 |
100 |
|
Harvesting |
54.14 |
12.07 |
6.55 |
8.62 |
18.62 |
0 |
100 |
|
Other cultivation activities |
56.69 |
17.72 |
5.51 |
5.12 |
12.99 |
1.97 |
100 |
|
Forestry |
55.56 |
11.11 |
0 |
0 |
33.33 |
0 |
100 |
|
Plantation |
53.83 |
19.39 |
5.61 |
3.57 |
16.33 |
1.28 |
100 |
|
Animal Husbandry |
84.38 |
3.13 |
0 |
6.25 |
6.25 |
0 |
100 |
|
Fisheries |
13.19 |
48.9 |
16.48 |
3.85 |
17.58 |
0 |
100 |
|
Other Agricultural Activities |
100 |
0 |
0 |
0 |
0 |
0 |
100 |
|
Manual work in non-agricultural activities |
16.87 |
49.79 |
17.28 |
1.65 |
12.76 |
1.65 |
100 |
|
Total |
45.53 |
24.09 |
8.44 |
5.36 |
15.71 |
0.86 |
100 |
Source: Estimated by author from NSSO 68th round.
Table 6: Education and female participation in Agriculture
|
OPERATION |
Illiterate |
Below Primary |
Primary |
Middle |
Secondary to Higher Secondary |
Above Higher Secondary |
Total |
|
Ploughing |
88.89 |
0 |
0 |
0 |
11.11 |
0 |
100 |
|
Sowing |
63.27 |
6.12 |
12.24 |
10.2 |
6.12 |
2.04 |
100 |
|
Transplanting |
80.56 |
2.78 |
5.56 |
5.56 |
5.56 |
0 |
100 |
|
Weeding |
80.51 |
4.24 |
7.63 |
4.24 |
3.39 |
0 |
100 |
|
Harvesting |
69.31 |
3.79 |
12.07 |
6.55 |
7.24 |
1.03 |
100 |
|
Other cultivation activities |
72.05 |
5.12 |
6.3 |
8.66 |
5.51 |
2.36 |
100 |
|
Forestry |
55.56 |
11.11 |
33.33 |
0 |
0 |
0 |
100 |
|
Plantation |
71.43 |
4.08 |
7.91 |
7.91 |
6.63 |
2.04 |
100 |
|
Animal Husbandry |
68.75 |
6.25 |
6.25 |
9.38 |
6.25 |
3.13 |
100 |
|
Fisheries |
64.29 |
4.95 |
14.29 |
7.14 |
4.95 |
4.4 |
100 |
|
Other Agricultural Activities |
66.67 |
0 |
11.11 |
0 |
11.11 |
11.11 |
100 |
|
Manual work in non-agricultural activities |
44.03 |
4.94 |
8.64 |
9.05 |
14.81 |
18.52 |
100 |
|
Total |
66.79 |
4.5 |
9.37 |
7.52 |
7.33 |
4.5 |
100 |
Table 7: Land holdings and Female Participation in Agriculture
|
OPERATIONS |
Land Holdings Categories |
||||||
|
0-0.002 Landless |
0.003-1.0 marginal |
1.001-2.0 Small |
2.001-3.0 Semi-Medium |
3.001-4.0 Medium |
4.000+ Large |
Total |
|
|
Ploughing |
0 |
88.89 |
0 |
0 |
0 |
11.11 |
100 |
|
Sowing |
2.04 |
69.39 |
8.16 |
4.08 |
2.04 |
14.29 |
100 |
|
Transplanting |
2.78 |
72.22 |
22.22 |
0 |
2.78 |
0 |
100 |
|
Weeding |
4.24 |
69.49 |
19.49 |
2.54 |
1.69 |
2.54 |
100 |
|
Harvesting |
0.69 |
73.7 |
13.15 |
6.57 |
2.77 |
3.11 |
100 |
|
Other cultivation activities |
0.39 |
75.98 |
12.99 |
5.12 |
2.36 |
3.15 |
100 |
|
Forestry |
11.11 |
33.33 |
55.56 |
0 |
0 |
0 |
100 |
|
Plantation |
0 |
73.2 |
14.18 |
5.67 |
2.84 |
4.12 |
100 |
|
Animal Husbandry |
3.23 |
64.52 |
19.35 |
0 |
9.68 |
3.23 |
100 |
|
Fisheries |
10 |
82.22 |
2.78 |
1.11 |
3.33 |
0.56 |
100 |
|
Other Agricultural Activities |
0 |
33.33 |
55.56 |
0 |
11.11 |
0 |
100 |
|
Manual work in non-agricultural activities |
5.86 |
78.66 |
9.21 |
2.93 |
0.84 |
2.51 |
100 |
|
Total |
2.73 |
74.61 |
12.66 |
4.22 |
2.55 |
3.23 |
100 |
Source: Estimated by author from NSSO 68th round.
The types of households are also having direct association with female participation scenario in farm activities. It is clear from NSSO’s 68th data on agricultural activities that almost half (46%) of the women participation in agricultural activities is coming from households that derive at least half of their income from their own farming. The highest female participation in ‘self-employed in agriculture’ is seen in ‘other agricultural activities’ (100%) and ‘animal husbandry’ (84%). This share is higher among women from the general category (57.43%), followed by OBCs (49.54%). In terms of tillage activity, one- third of female participation is coming from households who ‘self-employment in agriculture’ and a similar share is coming from households under ‘casual labor in non-agriculture’ category. The female participation in ‘self-employed in agriculture’ is also high for sowing, transplanting, weeding and harvesting that is 59%, 55.6%, 58.5% and 545 respectively. It is quite normal for the higher female participation in agriculture to come from households ‘self employed in agriculture’ as it is the main source of income for their family (Table 5).
The one quarter share of female participation is associated with ‘self-employed in non-agriculture households’. 10 to 15 % participation is recorded in major agricultural activities like ploughing, sowing, transplanting and harvesting. As major income source of these holds are non-agricultural activities, share of female participation in ‘animal husbandry’ that is the fundamental part of biodynamic agriculture, also found lowest here (3%). Females belong to ‘casual labour in agriculture’ is having the lowest share in farm operations (5.36%), followed by females from ‘regular wage/salary earning households (8.44%)’. Females from ‘regular wage earning households’ are having no or negligible participation in ploughing, transplanting and sowing kind of major farm activities (Table 5).
Education level is one of the key determinates of female participation in agriculture. An estimated 52–75% of Indian women engaged in agriculture are illiterate 28,51,52 also revealed that the Participation of women negatively correlated with education level. In case of NSSO 68 round, 67% female participating in agriculture of Uttar Pradesh are illiterate and majority of literate female engaged in agriculture is just having primary level education. As the level of education is increasing the female participation in agriculture is decreasing here. Hence education level and female participation is inversely associated. Almost similar scenario is found in case of animal husbandry. The participation is declining as the level of education is increasing. However a significant share of middle level educated female is engaged in animal husbandry here (9.4%). The share of illiterate women in agriculture is highest among the scheduled castes (78.76%), and lowest in the general category (43.78%). See Table 6
Land holding is another significant variables that affect the female participation in agriculture. In a study9revealed that land holding along with family income level and age effect women’s participation in agriculture. Mohiuddin Iqra et al (2020)50 also found that family female labour and hired female labor participation significantly depends on the landholding, household size, family type and level of education. A significant negative association is identified between land holding and female participation53.The female participation in Uttar Pradesh is found highest in families with marginal size of land holdings (74.61%), followed by small (12.66%) and medium land holding size (4.22%). It’s clearly evident from Fig 1.0 that the female participation in rural operations is inversely associated with land holding size. As the land holding size is increasing the female participation ratio is declining.
Association between Operations and Socio-Economic Variables of Female Participants
Linear regression post-estimate plots have been prepared to explore the association between female participation and various socio-economic variables. Through the graph no 1.o, it is evident that the highest share of female participation is coming from higher social groups like Other Backward Caste, General and less from Schedule Tribes & Schedule Caste categories. There is a good association between social groups and female participation in operations. But no clear association is there between age and female participation. As almost all age group females are engaged in various operations. Young aged female are more engaged in activities based on heavy labor like ploughing, harvesting etc.
Figure 1: Association between Operations and Socio-Economic Variables
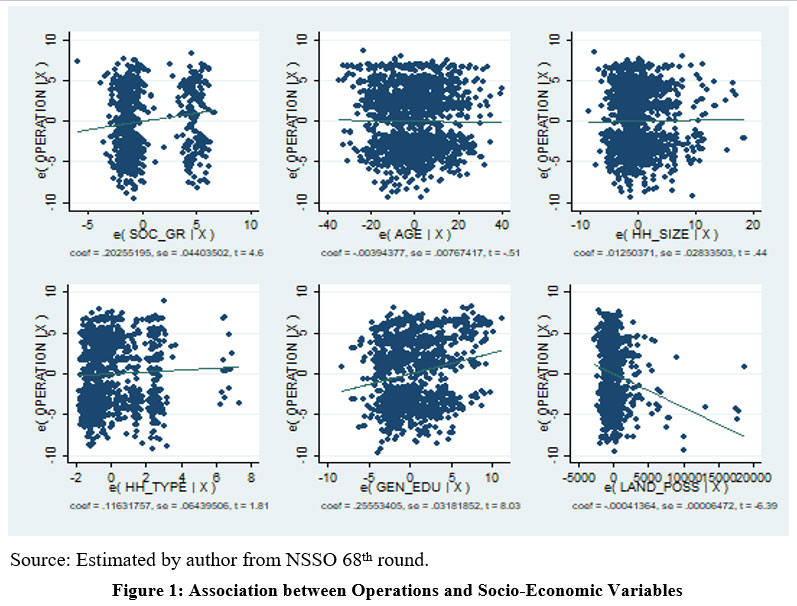 |
Figure 1: Association between Operations and Socio-Economic Variables |
Source: Estimated by author from NSSO 68th round.
The association between Household size and female participation is also have no clear relation here as different operations have different trend in use of female workers belong to different household size families. Same scenario has been followed by Household type and female participation in operations. Initial five activities are belongs to cultivation, after that non cultivation activities like animal husbandry, fisheries etc are listed here. The education levels of females engaged in cultivation are mostly inversely associated but this association is changed for non-cultivation based operations. As a result of that, overall a positive association has been appeared between operations (all) and female participation. The share of female participation is rapidly declining towards families having comparatively larger size of land. Land holding size and female participation is having strong negative association here (Graph 1.0).
Principal Component Analysis
Before doing factor analysis, it is very important to check the suitability of the data for this type of analysis.
Kaiser-Meyer-Olkin measure of sampling adequacy
For testing the data suitability for factor analysis, Kaiser-Meyer-Olkin measure is used. KMO takes values between 0 and 1, with small values indicating that overall the variables have too little in common to warrant a PCA. Variable with less than 0.5 KMO value is supposed to be unfit for such analysis. Here, all considered operations are having KMO value above 0.5, therefore suitable for Principal Component Analysis (PCA) (Table 9).
Table 8: Kaiser–Meyer–Olkin (KMO) measure of sampling adequacy
|
Operations |
SOC_GR |
Age |
HH_Size |
HH_TYPE |
Gen_Edu |
LAND_POSS |
Overall |
|
Ploghing |
0.471 |
0.527 |
0.530 |
0.700 |
0.530 |
0.542 |
|
|
Sowing |
0.488 |
0.484 |
0.465 |
0.668 |
0.576 |
0.580 |
0.541 |
|
Transplanting |
0.607 |
0.726 |
0.404 |
0.433 |
0.542 |
0.489 |
0.550 |
|
Weeding |
0.609 |
0.430 |
0.748 |
0.650 |
0.462 |
0.607 |
0.581 |
|
Harvesting |
0.633 |
0.445 |
0.562 |
0.661 |
0.465 |
0.579 |
0.543 |
|
Other cultivation activities |
0.609 |
0.452 |
0.459 |
0.560 |
0.517 |
0.563 |
0.531 |
|
Plantation |
0.341 |
0.565 |
0.631 |
0.565 |
0.441 |
0.590 |
0.535 |
|
Animal husbandry |
0.614 |
0.474 |
0.589 |
0.611 |
0.503 |
0.586 |
0.553 |
|
Other agricultural activities |
0.525 |
0.531 |
0.437 |
0.721 |
0.592 |
0.578 |
0.550 |
|
Manual work in non-agricultural activities |
0.590 |
0.541 |
0.556 |
0.600 |
0.615 |
0.597 |
0.582 |
|
Non-manual work in: cultivation |
0.786 |
0.749 |
0.698 |
0.709 |
0.652 |
0.723 |
|
|
Activities other than cultivation |
0.681 |
0.595 |
0.606 |
0.697 |
0.576 |
0.626 |
0.625 |
Source: Estimated by author from NSSO 68th round.
Identification of Principal Components
Principal components which are affecting the female participation in operations are identified here.
Ploughing
Is the major cultivation operation and highly based on muscular power as well. Therefore female participation is quite low in this category. The explanation of variability in participation is identified by PCA. The first four factors are explaining the maximum variability of women’s participation in tillage. Household type is having strong negative association (-0.619) as participation is high HH type 1 which is ‘self-employed in agriculture’ and reduces to HH type 2 (self-employed in non-agriculture), HH type 3 (regular wage/salary earning), HH type 4 (casual labour in agriculture) and HH type 4 (casual labour in non-agriculture others). General education is another significant variable which is effectively influencing the participation of women in ploughing. As the general education level is increasing, the participation is decreasing in this activity. Age and HH size are other significant variables that affect the participation. Working population is having an inverse relation with female participation (-0.622). Young females are involved more and share is decreasing as in high age group. HH size is having positive relation with female participation in ploughing (0.598). See table 9 Larger family size indicates availability of more women workers. Social category and land possession size are other important indicators which are affecting the female participation. More female participation has been seen in the lower class like and less in the upper class.
In case of sowing activity
first four factors are explaining the 87% variability of participation of female. General education is the most effective and positively associated here. Age is another significant variable that is positively associated with female participation for sowing activity. Since this job category requires a comparatively better level of education or knowledge and more experience, which is also evident from the strong positive association of education level (0.50) and age (0.687) here. HH size is negatively associated with female participation in sowing activities while social group is showing positive association here. Generally high education level is there in higher social groups and in families with more female casual labours and regular wage workers. In case of transplanting activities first four principal components are explaining the 90% variability of data of female participation in Uttar Pradesh. Factors such as social group and general education are most influential and positively associated with female participation here. Since transplanting is a labour intensive activity, land holding size and HH size is having the strong positive association with female participation for this activity that is 0.647 and 0.551 respectively. Third category of such factors includes the HH type. HH type with casual labors are having high share of female participation therefore showing the strong positive association here (0.620). Age is also significant variable that is affecting the female participation positively (0.809). In case of weeding activity, first three principal components are social groups, land possession and age. These components are explaining almost 70% variability here. First component is explaining almost one-third variability of data.
Harvesting activity
Is a laborious task of farming. 68% of the variability in women’s participation in harvesting is explained by the first three major components. The size of the land possessed, HH type and age are the major factors influencing female participation. Harvesting demands a large amount of labor in a short period. In such a situation, cultivators with large land size also need more number of workers. Due to this high demand of workers, maximum members of the families gather themselves for harvesting. As a result, the participation of women in this operation is seen to be high. Household types are also an important determinant of female participation. A large number of female participation is coming from families Self Employed in Agriculture activities. Women’s participation in harvesting activities is declining in households more dependent on non-agricultural activities and these households are having the higher code in household arrangement here. That is why there is a negative association between household types and female participation (-0.516) .See table 9.
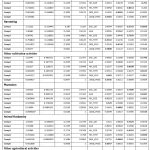 |
Table 9: Principal Component Analysis of Operations. |
Source: Estimated by author from NSSO 68th round.
The scenario of women participation in animal husbandry activities is quite interesting. 72% of the total people engaged in this activity in Uttar Pradesh are women (Table 1.).The first two principal components explain the variability of figures for female participation in animal husbandry activity up to 50%. Large land holdings, age of the participating member and level of education are the most important factors affecting the female participation in animal husbandry. There is a positive association in land holding size and women’s participation in animal husbandry (0.603).With large land holdings; farmers can easily grow fodder for livestock. On the other hand, cattle are also helpful for agriculture in larger farms which promote animal husbandry. Since animal husbandry is carried out around the houses, and does not demand a lot of muscular labor, women are easily able to participate Older women who are not very suitable to work in the fields continue to play an important role by contributing in animal husbandry. Here too, a strong positive relation is being seen in the age and participation of women participating in animal husbandry (0.711). The level of education and women’s participation in animal husbandry has a negative association here (-0.584). This means that female participation in animal husbandry decreases with increasing their educational level. Women’s participation in other-cultivation activities is significantly influenced by factors such as land holding size, worker’s age and family size (Table 9).
Women’s participation in other-agricultural activities is mainly influenced by the level of education, size of the family and size of the land holdings. A positive association is there between female participation and level of education (0.542), family size (0.693) and land holdings size (0.565). Female participation in Non-Manual work in cultivation and Activities other than cultivation is mainly affected by education level, household size and age (Table 9).
Conclusion
On the basis of above facts, it can be said that inequality in workforce participation in agriculture is very wide in Uttar Pradesh. Female participation in agriculture in Uttar Pradesh is influenced by several socio-economic factors. In these, household types, education level and size of land possessed are most important. Age is an important factor in operations that use comparatively more muscular power, such as ploughing. On the other hand, women’s participation is seen on a large scale in comparatively easy labor activities like animal husbandry, weeding. If we look at women’s participation on social group basis in all operations, then the largest share of women laborers come from scheduled societies. Even of the total females involved in various agriculture operations, 54% belong to the OBC, 27% to the SC, 15% to the general and 3.6% comes from ST category (Table 2). In these social groups with high female participation, the level of income and education are also seen to be comparatively low. These factors act as a push factor for the women of these groups.
Availability of more land does not always have the same effect on women’s participation in agriculture and related operations. Where this factor is positively correlated in activities such as animal husbandry, weeding and harvesting, it is negatively correlated in plantation. In addition, no significant correlation has been established between land size and female participation in activities such as plugging and sowing. Household size has a negative correlation with other agricultural activities and non-manual activities in agriculture. The age of female worker is showing negative correlation with almost all types of operations except ploughing and harvesting. This is indicating the increased participation in these operations as the age of the female worker increases. In view of the important participation of women in agriculture, they should be given more participants in policy decision making and skill training should be given for technical use, which will establish them as more capable and better productivity workers, especially in the field of agriculture.
Conflict of Interests
The authors declare that she have no known competing financial interests or personal relationships that could have appeared to influence the work reported in this paper.
Funding Sources
No funding is received from any agency/institution/individual in any form for the work of this manuscript.
References
- Roy, A. (1993), ‘Women Agricultural Labour in Bihar: A District Wise Analysis of Census Data’,.InAlakh. N. Sharma and Seema, Singh (ed), Women and Work Changing Scenario of India, Delhi: B.R. Publishing Corporation.
- ILO (2016), ‘Women at Work: Trends 2016’, International Labour Office – Geneva: ILO, 2016
- Krishna Rao, (2006). ‘Role of Women in Agriculture: A Micro Level Study,” Journal of Global Economy, Research Centre for Social Sciences,Mumbai, India, vol. 2(2), pages 107-118, June.
- Okali, C. and J. Mims.(1998), ‘Gender and Smallholder Diary Production in Tanzania.’ Report to the Livestock Production Programme of the Department for International Development (DFID): Appendix 1 and 2 pp. 37-38.
- Faridi, M.Z., Chaudhry, I.S., Mumtaz, A.,(2009), ‘The socio-economic and demographic determinants of women work participation in Pakistan: evidence from Bahawalpur district. S. Asian Stud. 24 (2), 351–367.
- Sen, G. (1983) “Women Agricultural Workers – Regional Variations in Incidence and Employment”. Working Paper No. 168, Centre for Development Studies, Thiruvananthapuram.
- Unni, J. (1992). ‘Women’s Participation in Indian Agriculture’, Oxford and IBH Publishing Co. Pvt. Ltd., New Delhi, Mumbai, Kolkata.
- Garikipati, S. (2008). ‘Agricultural wage work, seasonal migration and the widening gender gap: evidence from a semi-arid region of Andhra Pradesh’. European Journal of Development Research 20 (4): 629–648.
CrossRef - Chayal, K., and B.L. Dhaka. (2010). ‘Analysis of role performance of women in farm activities’. Indian Research Journal of Extension Education. 10 (2): 109–112.
- Guérin, I. (2013), ‘Bondedlabour, agrarian changes and capitalism: emerging patterns in South India’. Journal of Agrarian Change 13 (3): 405–423.
CrossRef - Ghosh, M., and A. Ghosh. (2014), ‘Analysis of women participation in Indian Agriculture’. International Journal of Gender and Women’s Studies 2 (2): 271–281.
- UN Women (2018), ‘Women’s Participation in the Agricultural Sector, Rural Institutions and Community Life’, REACH.
- Chowdhry, P. (1993), ‘High Participation and Low Evaluation: Women and Work in Rural Haryana’, Economic and Political Weekly, 28(52), A-135–A-147
- Firafis Haile (2016), ‘ Factors Affecting Women Farmers’ Participation in Agricultural Extension Services for Improving the Production in Rural District of Dendi West Shoa Zone, Ethiopia’. Journal of Culture, Society and Development www.iiste.org ISSN 2422-8400 An International Peer-reviewed Journal Vol.21, 2016. https://core.ac.uk/download/pdf/234691167.pdf
- Mulutena Sitachew, Paul Mansingh Jeyabalasingh& Mulu Debela (2018),‘Determinants of Rural Women’s Participation in Agricultural Extension Services: Case of Irrigable Vegetable Production in Oromia Region, Ethiopia’, Journal of Extension Education, 30 No. 3.
CrossRef - Arghyadeep Das, ShrutiMohapatra, NeelaMadhavPatnaik (2021), ‘Feminization of Indian Agriculture: A Review’, Agricultural reviews 2021 v.42 no.4 pp. 434-439
CrossRef
- Pattnaik, I., &Lahiri-Dutt, K. (2020), ‘What determines women’s agricultural participation? A comparative study of landholding households in rural India’, Journal of Rural Studies, 76, 25-39
CrossRef - Shiva, V. (1991).Most farmers in India are women. New Delhi: FAO.
- Kanchi, A., (2010), ‘Women Workers in Agriculture: Expanding Responsibilities and Shrinking Opportunities’, ILO Asia-Pacific Working Paper Series. Sub-regional Office for South Asia, New Delhi.
- Sen, G. (1983) “Women Agricultural Workers – Regional Variations in Incidence and Employment”. Working Paper No. 168, Centre for Development Studies, Thiruvananthapuram
- Baliyan, K.&Kumar, S. (2014), ‘Participation of Farm Household Women in Agricultural Activities and Its Determinants: AStudy in Western Uttar Pradesh’. Indian Journal of Labour Economics, 57(3), 327–341.
- Sonia Akter, Pieter Rutsaert, Joyce Luis, Nyo Me Htwe, Su Su San, Budi Raharjo, ArlynaPustika (2017), ‘ Women’s empowerment and gender equity in agriculture: A different perspective from Southeast Asia,Food Policy,Volume 69, 2017,Pages 270-279, ISSN 0306-9192, https://doi.org/10.1016/j.foodpol.2017.05.003
CrossRef - Kaur, P., Kaur, G., (2012), ‘Factors affecting female labour force participation in Punjab: an inter-district analysis’,. J. Res. Peace Gender Dev. 2 (4), 81–88.
- Verma, S.K. (1992). ‘Women in agriculture: A socio-economic analysis’. New Delhi: Concept Publishing Company.
- Chowdhry, P. (1993), ‘High Participation and Low Evaluation: Women and Work in Rural Haryana’, Economic and Political Weekly, 28(52), A-135–A-147
- Phillip, D., Nkoya, E., Pender, J., & Oni, O. A. (2009),‘Constraints to Increasing Agricultural Productivity in Nigeria: A Review. A Nigeria Strategy Support Program (NSSP). Background paper No NSSP 006, September
- Gebre, G.G., Isoda, H., Rahut, D.B. et al(2021),’Gender differences in agricultural productivity: evidence from maize farm households in southern Ethiopia. Geo Journal 86, 843–864 (2021). https://doi.org/10.1007/s10708-019-10098-y
CrossRef - Chowdhry, P. (1993), ‘High Participation and Low Evaluation: Women and Work in Rural Haryana’, Economic and Political Weekly, 28(52), A-135–A-147
- Government of India (2011), Primary Census Abstract, GoI, New Delhi
- Sundaram P.K. (2013), ‘Women Friendly Agricultural Engineering Technologies for Reducing Drudgery’, lecture Delivered During Model Training Course on Gender Perspective in Integrated Farming System w.e.f 17-24 January 2013 at ICAR Research Complex for Eastern Region, Patna, Bihar Available from: https://www.researchgate.net/publication/ 344237591_Women_Friendly_ Agricultural_Engineering_Technologies_for_Reducing_Drudgery
- (1998), ‘Village Chicken Production Systems in Rural Africa.Household Food Security and Gender Issues, by A.J. Kitalyi. The Food and Agriculture Organization, Rome.
- Guèye, E.F. (2000), ‘The Role of Family Poultry in Poverty Alleviation, Food Security and the Promotion of Gender Equality in Rural Africa’,. Outlook on Agriculture, Vol. 29(2): 129-136
CrossRef - Patel N. and TanuSethi (2021),‘Rural Women: lntegral for AatmaNirbhar Bharat’, Kurukshetra, April-2022
- Lastarria-corhiel, S. (2006),‘Feminization of Agriculture: Trends and Driving Forces’, Background paper for the World development Report 2008. November 2006.
- Deere, C.D. (2005), ‘The Feminization of Agriculture? Economic Restructuring in Rural Latin America’, United National Research Institute for Social Development, Occasional Paper 1.
- Tung, D.X. (2005), ‘Smallholder Poultry Production in Vietnam: Marketing Characteristics and Strategies.” Paper presented at the workshop Does Poultry Reduce Poverty? A Need for Rethinking the Approaches’, 30-31 August. Copenhagen, Network for Smallholder Poultry Development.
- Dutta, L.N. & Sharma, N. (1985). ‘Contribution of Female Labour in Agriculture: A Case Study of Ranchi District (Bihar)’,.Indian Journal of Agricultural Economics, 40(3).
- Arya, S.L. &Madhukar, R.M. (1988), ‘Impact of Watershed Management on Role of Women in Agriculture’. Abstracts, International Conference on Farm Women, Indian Council of Agricultural Research, New Delhi.
- Dev, S.M. (2004). “Female Work Participation and Child Labour: Occupational Data from NFHS”. Economic and Political Weekly, 39(7), 736–744
- Rufai, A. M. & Salman, K. K. &Salawu, M. B., (2018). ‘Input Utilization and Agricultural Labor Productivity: A Gender Analysis,’ Monographs: Applied Economics, AgEcon Search, number 302436, September.
CrossRef - Eapen, M. (1994), ‘Rural non-agricultural employment in Kerala: Some emerging tendencies’, Economics and Political Weekly, 29(21), 1285–1296.
- UNICEF (2011) Promoting gender equality: an equity-focused approach to programming. United Nations Children’s Fund, New York.
- Roshni Sanstha (2021) -Women Empowerment (SAFE) – NGO in India”. RoshniSanstha. Retrieved 26 April 2021.
- Medagbe F. M.K., Komatsu S., Mujawamariya G., Saito K.(2020), ‘Men and women in rice farming in Africa: A cross-country investigation of labor and its determinants.Frontiers in sustainable foods systems 2020, 4.
CrossRef - Gebre, G.G., Isoda, H., Rahut, D.B. et al(2021),’Gender differences in agricultural productivity: evidence from maize farm households in southern Ethiopia. Geo Journal 86, 843–864 (2021). https://doi.org/10.1007/s10708-019-10098-y
CrossRef - Government of India (2011), Primary Census Abstract, GoI, New Delhi
- Patel Neelam and TanuSethi (2021), ‘Rural Women: Key to New India’s Agrarian Revolution for Building AatmaNirbhar Bharat’. Kurukshetra Journal. December 2021.
- UB Singh, NK Mishra (2013 ), ‘Women work participation in rural Uttar Pradesh: a regional analysis’,.International Journal of Social Science and Interdisciplinary Research, Vol 2, Issue 8, pp 47-57
- Srivastava, N.&Srivastava. R. (2010), ‘Women, Work, and Employment Outcomes in Rural India’, Economic & Political Weekly, 155(28).
- IqraMohiuddin , Muhammad Asif Kamran , Shokhrukh-MirzoJalilov , Mobin-ud-Din Ahmad , Sultan Ali Adil , RazaUllah and TasneemKhaliq (2020), ‘Scale and Drivers of Female Agricultural Labor: Evidence from Pakistan’, Sustainability Volume 12 , Issue 16 10.3390/su12166633
CrossRef - Reddy, D.N., (1979), ‘Female work participation in India: facts, problems, and policies’. Indian J. Ind. Relat. 15 (2), 197–212.
- Tangka F.K., Jabbar M.A. and Shapiro B.I.( 2000). Gender roles and child nutrition in livestock production systems in developing countries: A critical review. Socio-economics and Policy Research Working Paper 27. ILRI (International Livestock Research Institute), Nairobi, Kenya.
- Waris, A., Nirmala, B., Kumar, A.S., (2016), ‘Gender gap and female workforce participation in agriculture in Andhra Pradesh, India’,. Afr. J. Agric. Res. 11 (9), 769–778.
CrossRef