
Introduction
The UN has proclaimed the 17 sustainable development goals as an effective method of global mobilization to achieve social priorities around the world, such as zero hunger.1 Sustainability includes agricultural practices without adverse environmental impacts, ensuring the production and quality of fruits and vegetables. Fertilizers have taken axial role with respect to boosting crops yield and nutritional quality especially after the development of fertilizer responsive crop varieties.2 The crop growth need essential nutrients to be appended in the soil are nitrogen, phosphorous, and potassium apart from other micro elements.3 Nitrogen required by the plants is usually supplied in the form of nitric acid, ammonium nitrate, synthetic ammonia, urea, or sodium nitrate. In our country unfortunately, large quantities of urea are applied to fertilize the soils.4 Although fertilizers are essential for agriculture to feed the growing population, the excessive use of large amounts of chemical fertilizers leads to environmental pollution.5 Besides, only 20–50% of the applied fertilizers are used efficiently; the other 50–80% is lost through leaching, emissions, or incorporation into the soil by microorganisms in the long term, generating ecological problems such as reduced soil fertility and economic losses.6 However, the key macronutrient elements applied to the soil reported the loss to the tune of 40–70, 80–90, and 50–90%, respectively, causing a considerable loss of resources. Moreover, nitrogen volatilization results in the release of nitrous oxides and thus being the greenhouse gases, contribute to the global warming.7 Loss of mineral nutrients through leaching and runoff to surface and ground water along with abundant volatilization constitute growing concerns owing to economic losses and environmental pollution. Nanofertilizers have been advocated owing to higher NUE as plants cell walls have small pore sizes (up to 20 nm) which result in higher nutrient uptake.8 Plant roots which act as the gateways for nutrients, have been reported to be significantly porous to nano materials compared to conventional manuring materials. Nano fertilizers are more efficacious in terms of nutrients absorption and utilization owing to considerably lesser losses in the form of leaching and volatilization.9 The research findings of a field investigations had proved nano nitrogen fertilizers improved the productivity of crops.10 It was inferred that nano nitrogen fertilizer hold potential to be used in place of mineral urea and it can also reduce environmental pollution caused by leaching, de-nitrification and volatilization of chemical fertilizers. The present study was planned to evaluate the performance of nano urea formulations on wheat crop and association among the commonly exploited measures in the multi locations trails for number of crops.
Materials and Methods
The treatments were evaluated at eight locations (Delhi, Gurdaspur, Gwalior, Hisar, Jammu, Karnal, Ludhiana and Pantnagar centers during 2021-22 cropping season with objective to maximize wheat productivity by optimizing the nitrogen dose and nano urea under irrigated conditions. The recommended agronomical interventions were followed after thorough ploughing and field layering as three replications were maintained. One third of nitrogen along with full dosage of phosphorus and potash as basal one and the remaining 1/3rd of nitrogen at first irrigation and 1/3rd at second irrigations to the plots. The experimental plots were of size 1.80 m x 8 m = 14.40 meter 2 to accommodate the 9 rows with 20 cm spacing among them. Total quantity of spray solution was 400 litre of water/ha with @ of 4 ml of nano urea/litre. The harvested produce of plot size 1.40 m x 7 m = 9.80 meter 2 ( as 7 inner rows x 7 m long were recorded to overcome the effects of border rows) were analysed statistically and homogeneity of locations mean squares were compared by Bartlett’s test and further analysis was carried out by AMMI soft and SAS 9.3 version software’s. A number of AMMI and BLUP measures (Anuradha et al., 2022)11 mentioned below for ready reference and details about treatments and locations in table 1.
Relative performance of genotypic values across environments
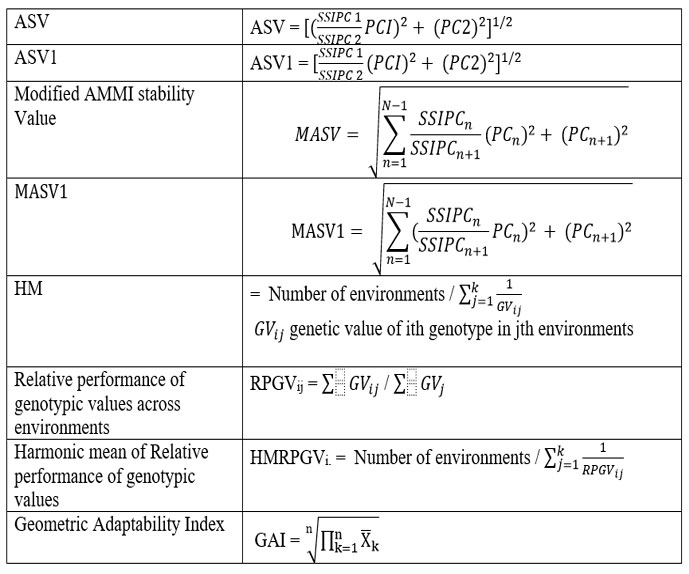
The stability measure as weighted Average of Absolute Scores has been defined (Olivoto et al., 2019)12 as
![]()
where WAASBi was the weighted average of absolute scores of the ith genotype; IPCAik was the score of the ith genotype (or environment) in the kth IPCA, and EPk was the amount of the variance explained by the kth IPCA. Superiority index has been devised that allowed weights between yield and WAASB as index
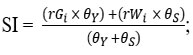
where rGi and rWi were the rescaled values for yield and, respectively. The superiority index had weighted between yield and stable performance of treatments to be of 65% and 35% respectively.
Table 1: Details of Nano fertilization treatments and locations of the north western plains zone
|
Code |
Treatment details of the experiment |
Code |
Locations |
|
T 1 |
Recommended N doses (1/3rd basal, 1/3rd CRI, 1/3rd tillering recommended N) + water spray at tillering & jointing |
L 1 |
Delhi |
|
T 2 |
Recommended N + one spray of nano urea at tillering |
L 2 |
Gurdaspur |
|
T 3 |
Recommended N + two spray of nano urea at tillering & jointing |
L 3 |
Gwalior |
|
T 4 |
Recommended N + two spray of urea (5%) at tillering & jointing |
L 4 |
Hisar |
|
T 5 |
75% of recommended N + water spray at tillering & jointing |
L 5 |
Jammu |
|
T 6 |
75% of recommended N + one spray of nano urea at tillering |
L 6 |
Karnal |
|
T 7 |
75% of recommended N + two spray of nano urea at tillering & jointing |
L 7 |
Ludhiana |
|
T 8 |
75% of recommended N + two spray of 5% urea at tillering & jointing |
L 8 |
Pantnagar |
|
T 9 |
50% of recommended N + water spray at tillering & jointing |
||
|
T 10 |
50% of recommended N + one spray of nano urea at tillering |
||
|
T 11 |
50% of recommended N + two spray of nano urea at tillering & jointing |
||
|
T 12 |
50% of recommended N + Two spray of 5% urea at tillering & jointing |
||
|
T 13 |
Control (without N only) |
Results and discussion
Analysis of Variance
Yield
Highly significant variations due to treatments, locations and TxL interactions were observed (Vaezi et al., 2019)13 for wheat yield by analysis of variance with 48.5%, 22.2% and 17.6% respectively (Table 2). First component of AMMI analysis shared share of about 51.3% while second accounted for 29.9% and third and fourth were of for 9.3%, 4.3% respectively of interactions sum of squares. Nearly 81.3% of the contributions were of first two significant components while total of 94.9% by significant components. The sums of squares for T×L signal were 79.7% and 20.3% by noise factor towards total of interaction effects. The less share by the residual terms in the analysis suggested further calculations based on interaction principal components for yield.
Thousands grains weight
Analysis of variance in table found highly significant variations due to locations, TxL interactions and treatments effects observed for thousands grains weight with respective share of 73.4%, 8.8% and 1.9% respectively (Table 2). First interaction component of AMMI analysis had contributed 51.3% while second accounted for 31.6% and third and fourth were of 9.7%, 4.2% respectively of interactions sum of squares. First two significant components had accounted for 82.9% of the contributions while total of 96.9% by significant components.
Table 2: ANOVA of nano urea treatments evaluated under multi location.
|
Source of variations |
Degree of freedom |
Mean Sum of Squares |
% share of factors |
TxL interaction Sum of Squares (% ) |
|||
|
Yield |
Thousands grains weight |
Yield |
Thousands grains weight |
Yield |
Thousands grains weight |
||
|
Treatments (T) |
12 |
677.29*** |
7.26** |
48.46 |
1.88 |
||
|
Locations (L) |
7 |
532.06*** |
486.52*** |
22.21 |
73.38 |
||
|
T x L interactions |
84 |
34.66*** |
4.86** |
17.36 |
8.79 |
||
|
IPC1 |
18 |
83.06 |
11.63 |
51.34 |
51.31 |
||
|
IPC2 |
16 |
54.45 |
8.08 |
29.92 |
31.66 |
||
|
IPC3 |
14 |
19.41 |
2.84 |
9.33 |
9.73 |
||
|
IPC4 |
12 |
10.48 |
1.42 |
4.32 |
4.16 |
||
|
IPC5 |
10 |
8.67 |
0.83 |
||||
|
IPC6 |
8 |
5.22 |
0.36 |
||||
|
Residual |
6 |
3.27 |
0.27 |
||||
|
Error |
192 |
7.03 |
3.122 |
||||
|
GxE total |
2911.82597 |
408.17249 |
|||||
|
GxE noise |
590.59049 (20.28%) |
262.30333 (64.26%) |
|||||
|
GxE signal |
2321.23547 (79.72% |
145.86916 (35.74%) |
|||||
|
Total |
311 |
53.93 |
14.92 |
||||
Treatments performance assessed by AMMI analysis measures
Yield
Maximum yield values were observed at Karnal location followed by Hisar more over maximum yield for 56.1 was expressed by T3 treatment (Fig 1). IPC1 measure selected T5, T8 treatments and T3, T12 would be desirable as per IPC2 values (Table 3). Measure IPC3 settled for T8, T4 while IPC4 favoured T1, T3 treatment formulation of the current study. IPC5 exhibited suitability of T11, T1 and IPC6 pointed for T13, T8. AMMI analysis based measures (ASV1 & ASV) considering the first two interaction principal components (81.3%%) selected T5, T8 and T8, T5 treatments, while MASV1 along with MASV settled for T8, T2 treatments.14 Average values found T3, T4, T2 treatments as suitable for maximum realization other measures GAI and HM also selected the same treatments. Adaptability measures PRVG, PRVG*Gm selected the treatments T3, T4, T2 as suitability of these treatments backed by values of HMPRVG, HMPRVG*Gm measures. The recent analytic measure while considering the weighted average of mean value and stability in the ratios of 65 to 35 i.e. Superiority Index pointed for T3, T8, T2 treatments as observed by other SIMe, SIGe, SIHe measures.
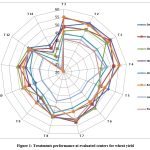 |
Figure 1: Treatments performance at evaluated centers for wheat yield. |
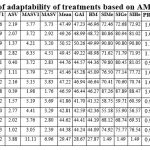 |
Table 3: Measures of adaptability of treatments based on AMMI analysis for yield. |
Thousands grains weight
Gwalior, Hisar and Karnal locations of the zone were able to express the large values for thousands grains weight whereas the maximum thousands grains weight obtained by T3 treatment (Fig 4). Treatments T13, T10 were selected by IPC1 measure and T11, T3 would be desirable as per IPC2 values (Table 6). Measure IPC3 settled for T8, T3 while IPC4 favoured T4, T10 treatment formulation of the current study. IPC5 exhibited suitability of T9, T6 and IPC6 pointed for T9, T1. ASV1 & ASV measures utilized 82.9% of interaction effects selected T7, T5, T6 treatments while MASV1 along with MASV settled for T6, T2 treatments. Average values for thousands grains weight found T3, T8, T9 treatments as suitable for maximum realization other GAI and HM measures values also selected the same treatments. Adaptability measures PRVG, PRVG*Gm selected the treatments T3, T8, T9 as suitability of these treatments were also backed by HMPRVG, HMPRVG*Gm measures. Superiority Index values had pointed for T3, T8, T7 along with values of SIMe, SIGe, SIHe measures.
Superiority index measures based on BLUP of treatments
Yield
The least value of W1 measure favoured T5, T8 for stable performance whereas W2 selected T5, T8 for the present study (Table 4). T5, T8 by value of W3 whereas W4 favoured T8, T5 while as per W5 treatments T8, T5 would express stable performance.15 Measure WAASB pointed for T8, T5 treatments also. Average value as per BLUP of treatments Gu pointed for T3, T4, T2 and measure GAIu found the higher values of T3, T4, T2 and Hmu measure settled for T3, T4, T2 nano urea formulations. Adaptability measures PRVG, PRVG*Gu found T3, T4, T2 and HMPRVG*Gu, HMPRVG measures had pointed towards T3, T4, T2. Superiority index values had settled for T3, T8, T2 nano urea treatments formulation of in the study.
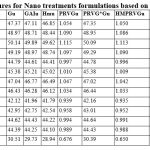 |
Table 4: Superiority Index measures for Nano treatments formulations based on BLUE and BLUP effects for yield. |
Thousands grains weight
T13, T10 whereas T11, T6 by least W1 and W2 values for the present study (Table 7). Value of W3 and W4 favoured the T11, T6 while W5 selected T11, T6 and WAASB pointed for T11, T6 treatments. Average value as per BLUP estimates of treatments Gu pointed for T3, T4, T7 and GAIu measure found T3, T4, T7 with higher values and Hmu measure settled for T3, T4, T7 treatments for nano fertilization formulations. Adaptability measures corresponding to BLUP estimates found T3, T4, T8 and T3, T4, T7 by PRVG, PRVG*Gu and HMPRVG*Gu, HMPRVG measures respectively.
Association among the measures as per Biplot analysis
Yield
An advantage of association analysis to club together the treatments or measures into homogenous groups those would assist to select genotypes or measures from different groups as per the objectives of the study. First two principal components of the studied measures and treatments combinations explained 84.7% of total variation. First component accounted for 68.8% while only 15.9% contributed by second one (Table 5). Measures SIMu, SIGu, SIHu, HMPRVG, HMPRVG*Gm, HMPRVGu, HMPRVG*Gu, PRVGu, PRVG*Gu were major contributors for first component whereas W1, ASV, ASV1, W4, W5 WAASB IPC3 accounted more for second component. Centres Jammu and Karnal had contributed more for the first while Hisar, Ludhiana for second one. T13, T3, T8 treatments had contributed more in first component whereas T4, T5, T8 shared more for second principal component for yield.
Table 5: Loadings of measures and treatments based on significant first two principal components
|
Measures |
Principal Component 1 |
Principal Component 2 |
Principal Component 1 |
Principal Component 2 |
|
|
Yield |
Thousands grains weight |
||
|
IPC1 |
0.0125 |
0.1435 |
0.0850 |
-0.0190 |
|
IPC2 |
0.1250 |
-0.0864 |
-0.1809 |
-0.0520 |
|
IPC3 |
-0.0583 |
0.2000 |
0.0298 |
-0.2427 |
|
IPC4 |
0.0350 |
0.1918 |
0.0345 |
0.0579 |
|
IPC5 |
0.0345 |
0.0625 |
0.0426 |
-0.0490 |
|
IPC6 |
-0.0070 |
0.0172 |
0.0060 |
0.0277 |
|
MASV1 |
0.1528 |
0.1583 |
-0.1026 |
0.1904 |
|
MASV |
0.1492 |
0.1741 |
-0.0937 |
0.2236 |
|
ASV1 |
0.1111 |
0.2844 |
-0.0193 |
0.2987 |
|
ASV |
0.1247 |
0.2684 |
-0.0353 |
0.2946 |
|
W 1 |
0.0707 |
0.3051 |
0.0484 |
0.2608 |
|
W 2 |
0.1274 |
0.2664 |
-0.0068 |
0.3010 |
|
W 3 |
0.1308 |
0.2598 |
-0.0057 |
0.3014 |
|
W 4 |
0.1274 |
0.2670 |
-0.0082 |
0.3022 |
|
W 5 |
0.1263 |
0.2695 |
-0.0077 |
0.3021 |
|
W AASB |
0.1260 |
0.2704 |
-0.0074 |
0.3023 |
|
Mean |
-0.1754 |
0.0987 |
0.1947 |
0.0637 |
|
GAI |
-0.1760 |
0.0935 |
0.1916 |
0.0590 |
|
HM |
-0.1766 |
0.0888 |
0.1881 |
0.0534 |
|
SIMe |
-0.1806 |
-0.0398 |
0.1913 |
-0.0917 |
|
SIGe |
-0.1805 |
-0.0436 |
0.1870 |
-0.0962 |
|
SIHe |
-0.1803 |
-0.0470 |
0.1822 |
-0.1008 |
|
PRVG |
-0.1754 |
0.0987 |
0.1899 |
0.0692 |
|
PRVG*Gm |
-0.1754 |
0.0987 |
0.1899 |
0.0692 |
|
HMPRVG |
-0.1766 |
0.0884 |
0.1930 |
0.0490 |
|
HMPRVG*Gm |
-0.1766 |
0.0884 |
0.1930 |
0.0490 |
|
Hmu |
-0.1764 |
0.0895 |
0.2011 |
0.0345 |
|
SIMu |
-0.1807 |
-0.0391 |
0.2025 |
0.0344 |
|
SIGu |
-0.1805 |
-0.0430 |
0.2038 |
0.0336 |
|
SIHu |
-0.1803 |
-0.0465 |
0.1910 |
-0.0984 |
|
PRVGu |
-0.1753 |
0.0997 |
0.1918 |
-0.1007 |
|
PRVG*Gu |
-0.1753 |
0.0997 |
0.1924 |
-0.1033 |
|
HMPRVGu |
-0.1765 |
0.0890 |
0.2015 |
0.0382 |
|
HMPRVG*Gu |
-0.1765 |
0.0890 |
0.2015 |
0.0382 |
|
Gu |
-0.1753 |
0.0997 |
0.2035 |
0.0306 |
|
GAIu |
-0.1759 |
0.0944 |
0.2035 |
0.0306 |
|
Delhi |
-0.1377 |
0.0621 |
0.1211 |
0.1434 |
|
Gurdaspur |
-0.1484 |
0.1585 |
0.2032 |
-0.0361 |
|
Gwalior |
-0.1546 |
0.0216 |
0.1423 |
-0.0653 |
|
Hisar |
-0.1516 |
0.1699 |
-0.1788 |
-0.0245 |
|
Jammu |
-0.1739 |
0.0660 |
0.1817 |
0.0220 |
|
Karnal |
-0.1676 |
0.0982 |
-0.0584 |
-0.0615 |
|
Ludhiana |
-0.1587 |
0.1597 |
0.1596 |
0.1311 |
|
Pantnagar |
-0.1349 |
-0.0317 |
0.0631 |
0.0785 |
|
T 1 |
-0.0845 |
0.2500 |
-0.1348 |
-0.1133 |
|
T 2 |
-0.1870 |
0.1987 |
0.0844 |
-0.0339 |
|
T 3 |
-0.2864 |
0.1257 |
0.5300 |
0.2209 |
|
T 4 |
-0.1013 |
0.5716 |
0.2220 |
0.4648 |
|
T 5 |
-0.1009 |
-0.4250 |
-0.0884 |
-0.1265 |
|
T 6 |
-0.0830 |
-0.2006 |
0.0768 |
-0.2446 |
|
T 7 |
-0.0530 |
0.2300 |
0.2432 |
-0.2240 |
|
T 8 |
-0.2020 |
-0.3654 |
0.2184 |
-0.1342 |
|
T 9 |
0.1277 |
-0.1806 |
-0.1505 |
0.6503 |
|
T 10 |
0.1430 |
0.1149 |
-0.1166 |
-0.2242 |
|
T 11 |
0.0062 |
-0.0248 |
-0.0490 |
-0.2148 |
|
T 12 |
-0.0538 |
-0.3181 |
-0.1567 |
-0.1802 |
|
T 13 |
0.8748 |
0.0236 |
-0.6788 |
0.1596 |
|
% share of variation |
68.80 |
15.88 |
50.38 |
24.64 |
Pantnagar had expressed strong bondage with superiority index measures while considering mean, GAI and HM of treatments based on fixed and random effects of treatments (Fig 2). WAASB, W3, W2, W5 had maintained direct association with MASV, MASV1 on right hand side and with ASV1, W1, IPC4 on left side.IPC3 with Hisar, Ludhiana and Gurdaspur showed direct relationship while Delhi, Karnal, Gwalior with adaptability measures values as per BLUE and BLUP of treatments effects. W1 showed right angles with Hisar, Ludhiana, Gurdaspur values, IPC3 with MASV, MASV1 values, IPC2 with ASV1, WAASB measures, adaptability measures with W1 values in biplot analysis. Right angle of IPC2 observed with Hisar, Ludhiana, Gurdasur centres. Treatments T13, T5 and T4 would express unstable yield as compared to T11, T6, T7 placed near to origin of biplot analysis. Unstable performance of T3,T4,T5,T8 treatment combinations would be observed as compared to T11, T6, T9, T10 treatments of the present study as placed near to origin in biplot analysis. The measures that brought the lowest variability of the interaction effects were IPC6, IPC5, IPC1 which was manifested by the their shortest vectors among all the studied measures.
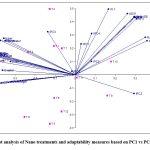 |
Figure 2: Biplot analysis of Nano treatments and adaptability measures based on PC1 vs PC2 for yield |
Pantnagar had placed with superiority index measures based on fixed and random effects of treatments in first cluster (Fig 3). Small cluster of MASV and MASV1 placed along with cluster of IPC1, IPC4, IPC5 values. Both these clusters were observed near to cluster of ASV, ASV1, W1, W2, W3, W4, WAASB measures. Next quadrant observed cluster of IPC3 with Hisar, Ludhiana, Gurdaspur centres. Adaptability measures based on fixed and random effects of treatments PRVG, HMPRVG, PRVGu, HMPRVGu, PRVG*Gm, HMPRVG*Gm along with measures of central tendency mean, GAI, HM, GAIu, HMu formed cluster with Karnal, Delhi and Gwalior centers.
Thousands grains weight
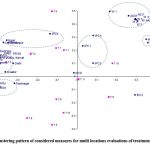 |
Figure 3: Clustering pattern of considered measures for multi locations evaluations of treatments for yield |
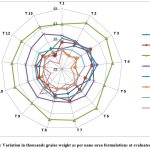 |
Figure 4: Variation in thousands grains weight as per nano urea formulations at evaluated centers |
First two principal components of the studied measures and treatments combinations explained 75% of total variation. First component accounted for 50.4% while only 24.6% contributed by second one. Measures Hmu, HMPRVGu, HMPRVG*Gu, GAIu, PRVGu, PRVG*Gu were major contributors for first component whereas WAASB, W4, W5, W3, W2, ASV, ASV1 accounted more for second component. Gurdaspur and Jammu were major contributors for first whereas Delhi, Ludhiana was for the second one. Nono urea treatments T13, T3, T7 had contributed more in first component whereas T9, T4, T6 shared more for second principal component (Table 5). T9, T4, T3,T8 treatment combinations would be of unstable performance as far as thousands grains weight was concerned as compared to T2, T1, T5 treatments of the study as placed near to origin in biplot analysis. The measures that brought the lowest variability of the interaction effects were IPC6, IPC4, IPC5, IPC1 which was manifested by the their shortest vectors among all the studied measures. Straight line angle of IPC3 observed with ASV values, Karnal with Ludhiana, Hisar with Jammu, IPC2 with PRVG, MHRVG values (Fig 5). Right angle of W1 was observed with superiority index measures. ASV, ASV1 had ninety degree angles with adaptability measures based on fixed and random effects of treatments. Hisar and IPC2 showed right angle with W2, W4, WAASB values. Ludhiana center had expressed right angles with MASV, MASV1 values. AMMI analysis based measures ASV, ASV1 had showed direct association with MASV, MASV1 on one side and with W2, W$, WAASB on other side. IPC2 had maintained strong bondage with Hisar and Karnal locations. Gwalior had expressed strong association with superiority index measures and with Gurdaspur location, IPC1 values. Direct relation of Delhi with Pantnagar and Ludhiana was also observed. Tight association among Adaptability measures irrespective of BLUE and BLUP effects of treatments effects had been found with corresponding mean, GAI and HM measures.
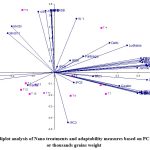 |
Figure 5: Biplot analysis of Nano treatments and adaptability measures based on PC1 vs PC2 for thousands grains weight |
Karnal, Hisar joined with IPV2 in first cluster while Gurdaspur with Gwalior joined hands with superiority index measures in second cluster of biplot analysis (Fig 6). Next cluster was of adaptability measures PRVG, HMPRVG, PRVG*Gu, HMPRVG*Gu, mean, GAI, HM with Jammu, Delhi and Ludhiana centres. Next cluster of IPC4, IPC6 with Pantnagar observed near to large cluster of adaptability measures PRVG, HMPRVG, PRVG*Gu, HMPRVG*Gu. Values of W3 with W2, W4 formed cluster with WAASB values and last cluster of MASV and MASV1 was showed in fourth quadrant.
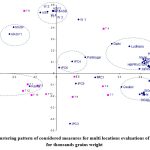 |
Figure 6: Clustering pattern of considered measures for multi locations evaluations of treatments for thousands grains weight |
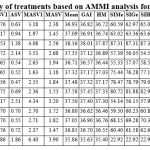 |
Table 6: Measures of adaptability of treatments based on AMMI analysis for thousands grains weight. |
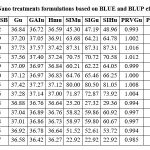 |
Table 7: Superiority Index measures for Nano treatments formulations based on BLUE and BLUP effects for thousands grains weight. |
Conclusions
AMMI analysis observed highly significant variations due to treatments, locations and TxL interactions during evaluation of nano urea formulations at number of locations in the north western plans zone of the country. Maximum yield was observed at Karnal followed by Hisar more over maximum yield was expressed by T3 treatment. ASV1 & ASV measures selected T8, T5 treatments. Average of thousands grains weight found T3, T8, T9 treatments as suitable for maximum realization and as per MASV1 and MASV settled T6, T2 treatments for thousands grains weight. Adaptability measures corresponding to BLUP estimates of yield i.e. PRVG, PRVG*Gu, HMPRVG*Gu, HMPRVG measures found T3, T4, T2 treatments for yield. Biplot analysis observed WAASB, W3, W2, W5 had maintained direct association with MASV, MASV1 on right hand side and with ASV1, W1, IPC4 on left side for yield. Treatments T13, T5 and T4 would express unstable yield as compared to T11, T6, T7 placed near to origin of biplot analysis. Thousands grains weight found that Karnal, Hisar centers with IPV2 formed the first cluster while Gurdaspur with Gwalior joined hands with superiority index measures in second cluster of biplot analysis. Next cluster was of adaptability measures PRVG, HMPRVG, PRVG*Gu, HMPRVG*Gu, mean, GAI, HM with Jammu, Delhi and Ludhiana centres. Next cluster of IPC4, IPC6 with Pantnagar observed near to large cluster of adaptability measures PRVG, HMPRVG, PRVG*Gu, HMPRVG*Gu.
Acknowledgment
The hard work of all the working staff at coordinating centers of AICRP(W&B) was sincerely acknowledged for the field conduct of research trials.
Conflict of Interest
The authors declare that there is no conflict of interest regarding the publication of this paper.
Funding Sources
The funds received under coordinated setup had been utilized for the conduct and monitoring of field trials at respective research centers.
References
- Ali S.S., Al-Tohamy R., Koutra E., Moawad M.S., Kornaros M., Mustafa A.M., Mahmoud Y.A.G., Badr A., Osman M.E.H., Elsamahy T. Nanobiotechnological advancements in agriculture and food industry: Applications, nanotoxicity, and future perspectives. Sci. Total Environ. 2021;792: 148359.
CrossRef - Astaneh N., Bazrafshan F., Zare M., Amiri B., and Bahrani, A. Nano-fertilizer prevents environmental pollution and improves physiological traits of wheat grown under drought stress conditions. Scientia Agropecuaria. 2021;12(1): 41-47.
CrossRef - Ramírez-Rodríguez G. B., Miguel-Rojas C., Montanha G. S., Carmona F. J., Dal Sasso G., Sillero J. C., Delgado-López J. M. Reducing nitrogen dosage in triticum durum plants with urea doped nanofertilizers. 2020;10(6): 1043.
CrossRef - Nongbet A., Mishra A.K., Mohanta Y.K., Mahanta S., Ray M.K., Khan M., Baek K.-H., Chakrabartty I. Nanofertilizers: A Smart and Sustainable Attribute to Modern Agriculture. Plants. 2022;11: 2587. https://doi.org/ 10.3390/plants11192587.
CrossRef - Verma K.K., Song X.P., Joshi A., Tian D.D., Rajput V.D., Singh M., Arora J., Minkina T., Li Y.R. Recent Trends in NanoFertilizers for Sustainable Agriculture under Climate Change for Global Food Security. Nanomaterials. 2022;12: 173
CrossRef - Kumari R., Singh D.P. Nano-biofertilizer: An Emerging Eco-friendly Approach for Sustainable Agriculture. Proc. Natl. Acad. Sci. India Sect. B Biol. Sci. 2020;90:733–741.
CrossRef - Burhan S. A., and AL-Hassan, M. G. Impact of nano npk fertilizers to correlation between productivity, quality and flag leaf of some bread wheat varieties, Iraqi Journal of Agricultural Sciences. 2019;1029(50):1-7
CrossRef - Kannoj, Choudhary J., Jain D., Tomar M., Patidar R. and Choudhary R. Effect of Nano Urea vs Conventional Urea on the Nutrient Content, Uptake and Economics of Black Wheat (Triticum aestivum L.) along with Biofertilizers. Biological Forum – An International Journal. 2022;14(2a): 499-504
- Ahmadian K., Jalilian J., and Pirzad A. Nano-fertilizers improved drought tolerance in wheat under deficit irrigation, Agricultural Water Management. 2021;244: 106544.
CrossRef - Bhardwaj A.K., Arya G., Kumar R., Hamed L., Pirasteh-Anosheh H., Jasrotia P., Kashyap P.L., Singh, G.P. Switching to nanonutrients for sustaining agroecosystems and environment: The challenges and benefits in moving up from ionic to particle feeding. J. Nanobiotechnol. 2022;20:19.
CrossRef - Anuradha N., Patro T.S.S.K., Singamsetti A., Sandhya Rani Y., Triveni U. Comparative Study of AMMI- and BLUP-Based Simultaneous Selection for Grain Yield and Stability of Finger Millet [Eleusine coracana (L.) Gaertn.] Genotypes. Front. Plant Sci. 2022;12: 786839.
CrossRef - Olivoto T., Lucio A.D., da Silva J.A., Marchioro V.S., de Souza V.Q., Jost E. Mean performance and stability in multi-environment trials I: combining features of AMMI and BLUP techniques. Agronomy. 2019;111:2949–2960.
CrossRef - Vaezi B., Pour-Aboughadareh A., Mohammadi R., Mehraban A., Hossein-Pour T., Koohkan E. Integrating different stability models to investigate genotype x environment interactions and identify stable and high-yielding barley genotypes. Euphytica. 2019;215:63.
CrossRef - Koundinya A.V.V., Ajeesh B.R., Hegde V., Sheela M.N., Mohan C., Asha K.I. Genetic parameters, stability and selection of cassava genotypes between rainy and water stress conditions using AMMI, WAAS, BLUP and MTSI. Sci. Hortic. 2021;281:109949.
CrossRef - AL-Abody M. A. K., AbdWahid M. A., and Jamel, F. A. Effect of Foliar Applicalion of Nanofertilizer of Iron on Growth and Biological Yield of Varieties Wheat (Triticum aestivum L.). American Journal of Life Science Researches. 2021;9(1): 8-17.