

Introduction
Guava (Psidium guajava) is one of the major marketable fruits in India. Subsequent to mango, banana, and citrus, it ranks as the fourth most significant fruit. Tropical and subtropical environments both facilitate guava cultivation1-2.Guava is a climacteric fruit belongs to family Myrtaceae and endure delicious fruits3-4 and also known as the apple of tropical and subtropical countries5-6.To obtain guava of excellent quality, it is necessary to choose the right period for harvesting. In order to obtain guava that fulfills the quality requirements and the selling period, indicators of maturity must be used to calculate the guava harvest time7.Desiccation after harvest, together with mechanical damage, are significant issues. Desiccation causes the skin to become dull, yellow, and occasionally puckered, whereas mechanical damage causes browning that may penetrate the flesh. Skin and flesh that have been mechanically damaged are more prone to deterioration8-9. Although guavas are in great demand, an extensive fruit fly infestation caused by Bactrocera diversus throughout the summer months severely decreases the yield that can be sold and costs farmers money. Fruit fly larvae eat within the developing fruits, causing the majority of the damage by lowering the quality, yield, and shelf life of the fruits10.
Over 33 per cent of the worldwide food supply is wasted or lost, amounting to 1.3 billion tonnes per year and costing the global economy around 750 billion dollars11. The post-harvest losses in guava range from 20 to 40 percent of the crop in nations that are developing12. The production of fruits in India is 97.96 MT in 2018-1913. The share of post-harvest losses of horticulture produces varies between 5-39 per cent of total production in India14.
Various studies were performed earlier to analyze the post-harvest losses of fruits in India. The latest study on post-harvest losses of agri produces in India was performed by NABARD Consultancy Services (NABCONS) that was awarded by the Ministry of Food Processing Industries (MoFPI), Government of India in the year 2022. According to Department of Horticulture, Rajasthan the production of guava in Sawai Madhopur district of Rajasthan was 27452 MT in 2020-21. The findings of the study show that post-harvest losses were 15.05% in guava at national level5. West Bengal had the most total post-harvest losses in guava (15.86%), while Chhattisgarh had the lowest (13.79%).
Pink flesh guavas had a total post-harvest loss of 17.06%, made up of losses at the field and retail levelsof 11.47% and 5.59%respectively16. Despite tremendous growth in fruit and vegetable production, massive fruit losses—estimated to range from 6.70 per cent (for papaya) to 15.88 per cent (for guava) occur throughout various phases of handling, transportation, storage, processing, and distribution17.The entire cost of the losses of fruits and vegetables, the economy would also suffer macroeconomic losses up to crores of rupees. India yearly loses fruits worth ₹ 12700 – 15876 crores (a loss of 20 to 25 per cent at an aggregate price of ₹ 10,000/t) and vegetables worth ₹ 12588 crores (a loss of roughly 20 per cent at an aggregate price of ₹ 5000/t). Between 25289 and 28464 crores of rupees are lost in fruits and vegetables together18.
Fruits and vegetables have limited shelf life and account for 70 per cent of all food waste, accounting for 40 per cent of the overall financial loss. India is having some difficulty feeding its huge population, and the food situation is likely to deteriorate significantly in the next few years.
The different types of post-harvest losses were founds in guava at different stages of farm level in the study of CIPHET, 2012 and NABCONS, 2022. To recognize such types of losses and their quantification, this research was performed in Sawai Madhopur as it is the highest guava producing area in Rajasthan. For the accomplishment of the research following objectives were considered:
Quantitative assessment of post-harvest losses of guava at farm level and the cause of these post-harvest losses.
Factors responsible for post-harvest losses in guava
Materials and Methods
The current research was performed in Sawai Madhopur district of Rajasthan because of the highest area and production among other districts of Rajasthan. The area and production of guava in Sawai Madhopur district was 4261 ha and 27452 MT respectively in the year 2020-21 which was highest amongst other districts of Rajasthan (Agriculture Department Rajasthan, 2022). The research was performed in the year 2022. From the district two tehsils, Sawai Madhopur and Chauth ka Barwara were selected through judgmental sampling on the basis of highest guava production among other tehsils of the district (Figure 1). From each tehsil two villages (Karmoda and Gambhira from Sawai Madhopur tehsil; Kausthala and Adalwara from Chauth ka Barwara tehsil) were selected through judgmental sampling. Data was taken from 40 farmers through a structured schedule. For the quantitative assessment, the questions were asked to farmers about method of operation, quantity handled, loss and cause for loss at each step of collection, transportation to storage house, sorting, grading, packaging and transportation to mandi.
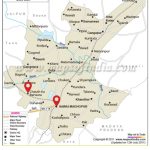 |
Figure 1: Map showing the selected tehsil. |
The estimation of losses were carried out at district level through enquiry approach. For estimation of post-harvest loss in farm operations, a simple average was taken for the quantity handled and quantity loss at each operation level and further percentage of loss was calculated.
For the estimation of losses at district level the following modified formulas were used:
Total quantity of fruit handled for a particular farm operation at district level was calculated by the formula15 (i):
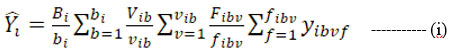
Where,
Y = Estimate of quantity handled for a particular farm operation of the crop/commodity in 𝑖𝑡ℎdistrict
𝐵𝑖= Total number of blocks in 𝑖𝑡ℎ district
𝑏𝑖= Number of selected blocks in 𝑖𝑡ℎ district
𝑉𝑖𝑏= Total number of villages in 𝑏𝑡ℎ selected block of 𝑖𝑡ℎ district
𝑣𝑖𝑏= Number of selected villages in 𝑏𝑡ℎ selected block of 𝑖𝑡ℎ district for a farm operation
𝐹𝑖𝑏𝑣= Total number of farmers growing a particular crop/commodity in 𝑣𝑡ℎ selected village of 𝑏𝑡ℎselected block from 𝑖𝑡ℎ district
𝑓𝑖𝑏𝑣= Number of selected farmers growing a crop/commodity in 𝑣𝑡ℎ selected villages of 𝑏𝑡ℎselected block of 𝑖𝑡ℎ district for a farm operation
𝑦𝑖𝑏𝑣𝑓 Quantity handled for a farm operation of a crop/commodity by the 𝑓𝑡ℎ selected farmer in 𝑣𝑡ℎselected village of bth selected block of 𝑖𝑡ℎ district
An estimate of quantity of the fruit loss in the same farm operation in 𝑖𝑡ℎ district was computed using the formula (ii):
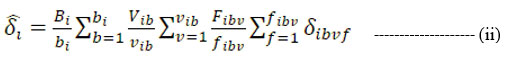
Where,
𝛿𝑖 = Estimate of quantity lost for a farm operation of a crop/commodity in 𝑖𝑡ℎ district
𝛿𝑖𝑏𝑣𝑓= Quantity of crop/commodity lost at a particular farm operation by the 𝑓𝑡ℎ selected farmer in 𝑣𝑡ℎ selected village of 𝑏𝑡ℎ selected block for 𝑖𝑡ℎ district
The loss (%) obtained by enquiry for the fruit in 𝑖𝑡ℎ district was estimated by dividing the total quantity lost by the total quantity handled, using the formula (iii):
![]()
Where,
= Estimate of loss (%) for the 𝑖𝑡ℎ district
A set of 18 statements/factors that are associated with the present research were chosen from the extensive list of discovered post-harvest factors that was compiled with the assistance of experts and a review of the literature. Farmers were asked to mark their preference on a 5 point Likert scale with respect to the importance of selected factors responsible for post-harvest losses. These factors were compared using Friedman’s test. The test statistics of Friedman’s test is given by the formula (iv):
![]()
Where,
Rj =sum of the ranks for sample j
n = number of independent block
k = number of groups
Results and Discussion
The data was taken from farmers on post-harvest losses in guava about method of operation, quantity handled, quantity loss and cause for loss at each step of operation such as collection & transportation to storage house, sorting, grading, packaging and transportation to mandi. Simple average of quantity handled and quantity loss was calculated for each level at farm operation and the percentage of loss at each level was also calculated which was given in table 1.
Table 1 revealed that the total quantity handled during collection &transportation to storage house operation was 14273 kg/ha, quantity loss was 273 kg/ha and the percentage of loss at same operation was 1.91 per cent due to inappropriate collection material and falling of overripe fruits. The total quantity handled during sorting was 14000 kg/ha, quantity loss during sorting was 1050 kg/ha and the percentage of loss at the same operation was 7.5 per cent. The highest loss among other operations was found during sorting only because fruit was attacked by fruitfly, diseased fruits and overripe fruits which were sorted out during sorting operation. The total quantity handled during grading was 12950 kg/ha, quantity loss during grading was 224 kg/ha and the percentage of loss at the same operation was 1.73 per cent due to inappropriate grading by labours. There were three types of grading done by farmers of study area through manual operation that was A, B, C type and the fruits were taken out which did not fall in these types of grading categories. The total quantity handled during packaging was 12726 kg/ha, quantity loss during packaging was 168 kg/ha and the percentage of loss at same operation was 1.32 per cent because some infected fruit, unequal size fruits left in the course of sorting and grading which can be taken out during packaging in crates. The total quantity handled during transportation was 12558kg/ha, quantity loss during transportation was 199.5 kg/ha and the percentage of loss at same operation was 1.59 per cent due to jerk of vehicle, overloading and friction between fruits. Sometimes the overripe fruit remained in the crates during transportation which further damages the other fruits also.
Table 1: Quantity Handled and Loss at Each Level during Post-Harvest Operations
| Methods/
Operations |
Quantity handled (kg/ha) | Quantity loss (kg/ha) | Mean Loss (%) | Standard Deviation | Confidence level (95%) |
| Collection | 14273 | 273 | 1.91 | 1.12 | 0.36 |
| Sorting | 14000 | 1050 | 7.5 | 1.85 | 0.59 |
| Grading | 12950 | 224 | 1.73 | 1.33 | 0.42 |
| Packaging | 12726 | 168 | 1.32 | 0.93 | 0.30 |
| Transportation | 12558 | 199.5 | 1.59 | 0.93 | 0.30 |
Source: Researcher’s own computation from primary data
The descriptive statistics were executed for the loss at each operation at farm level as shown in table 1. The average/mean loss percentage during collection and transportation to storage house was 1.96 per cent, standard deviation was 1.12 and confidence level at 95 per cent was 0.36. Similarly, the descriptive statistics of each operation was executed and presented in table 1 and figure 2.
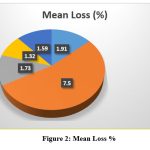 |
Figure 2: Mean Loss % |
The overall post-harvest losses in district level was calculated through the formula of estimated percentage of loss ( ) as given in formula equation iii. The results of estimation are shown in table 2.
Table 2: Post-Harvest Losses in Guava at District Level
| Methods/Operations
|
Collection
|
Sorting
|
Grading
|
Packaging
|
Transportation | Overall loss |
| Loss % | 1.91
± 0.1764 |
7.50
±0.2929 |
1.73
±0.2105 |
1.32
±0.087 |
1.59
±0.1472 |
14.05 |
Note: Figures in the table represent “Loss ± Standard Error (SE) ×1.96”
Source: Researcher’s own computation from primary data
The results of table 2 depicts that the overall post-harvest losses in guava was 14.05 per cent at district level. The post-harvest loss during collection & transportation to storage house was (1.91%), sorting (7.50%), grading (1.73%), packaging (1.32%) and transportation (1.59%) at district level majorly contributed to the post-harvest losses in guava.
The results of the study were supported by the study of NABCONS in 2022 and CIPHET in 2015 on the post-harvest losses of agri produces in India19.
Factors responsible for post-harvest losses at farm level
H0 = There is no significant difference in the factors influencing post-harvest losses in guava
H1 = There is significant difference in the factors influencing post-harvest losses in guava
A set of 18 significant factors that are associated with the present research were chosen from the extensive list of discovered post-harvest factors that was compiled with the assistance of experts and a review of the literature. Farmers were asked to mark their preference on a 5 point Likert scale with respect to the importance of selected factors responsible for post-harvest losses. These factors were compared using Friedman’s two-way ANOVA.
Table 3: Test statistics of Friedman test
| Test Statisticsa | |
| N | |
| Chi-Square | 280.989 |
| df | 17 |
| Asymp. Sig. | .000 |
|
a. Friedman Test |
|
Source: Researcher’s own computation from primary data
Table 4: Hypothesis test summary
| Null Hypothesis | Test | Sig. | Decision |
| There is no difference in the factors influencing post-harvest losses in guava | Related samples Friedman’s Two way Analysis of Variance by Ranks | .000 | Reject the null hypothesis |
Source: Researcher’s own computation from primary data
Table 3 reflected that the computed p-value is less than the significant level at five per cent (p < 0.05) with test statistics Chi-Square = 280.989and df = 3 (n-1=18-1=17). Therefore, it can be inferred that the level of influence of different factors to the post-harvest losses is different according to farmers (Table 4).
Similar results were obtained in the study of Gill, 201520.In the study, Friedman’s test was used to evaluate the factors that influence farmers’ decisions about value addition and post-harvest technology.
Table 5: Factors responsible for post-harvest losses at farm level based on mean ranks of Friedman’s test
| Sr. No. | Factors | Mean Rank | Homogenous groups* | ||
| 1 | Inappropriate sorting causes more loss to fruits | 14.43 | A | ||
| 2 | Inappropriate grading causes more loss to fruits | 14.35 | A | ||
| 3 | Heavy rainfall causes more loss to fruits | 13.68 | A | B | |
| 4 | Insect infestation is high in Guava crop | 13.61 | A | B | |
| 5 | Disease infection is high in Guava crop | 13.26 | A | B | |
| 6 | Market infrastructure is not good during season | 10.64 | A | B | C |
| 7 | Low temperature during ripening causes more loss to fruits | 10.54 | A | B | C |
| 8 | Mechanical injury is more in fruits due to bad handling | 9.39 | B | C | |
| 9 | Bad transportation causes more loss to fruits | 8.99 | B | C | |
| 10 | Bird damage is high in Guava | 8.66 | B | C | |
| 11 | Inappropriate collection material causes more loss to fruits | 7.75 | B | C | |
| 12 | Animals damages the Fruits | 6.85 | B | C | |
| 13 | Inappropriate harvesting method causes more loss to fruits | 6.68 | B | C | |
| 14 | Physiological disorder is more in fruits | 6.40 | B | C | |
| 15 | Fruit is not timely harvested due to lack of manpower | 5.71 | C | ||
| 17 | High humidity causes more loss to fruits | 5.48 | C | ||
| 18 | Poor packaging material causes more loss to fruits | 5.20 | C | ||
*Mean ranks having same letters are significantly equivalent
Source: Researcher’s own computation from primary data
Table 5 interpreted that the mean ranks corresponding to inappropriate sorting causes more loss to fruits (14.43) and inappropriate grading causes more loss to fruits (14.35) were the highest among all other factors. Sorting and grading are the most important operations which maintain the quality of fruits by removing diseased, infected and oversized fruit out of packaging. But due to the unavailability of proper skilled labour and sorting & grading practices, some diseased and oversized fruits were left in crates which further caused deterioration in other fruits. Farmer’s ranked heavy rainfall during ripening of fruits (13.68) creative the conducive environment for the attacking of fruitfly, Insect infestation is high in Guava crop (mean rank 13.61) as fruitfly is the key insect that damages the fruits and creates a huge post-harvest losses and infection is high in Guava crop with mean rank (13.26) as shown in figure 4. Diseases such as anthracnose (fruit rot), guava wilting and dieback causes more damage to the fruits which further contributes to the post-harvest losses.
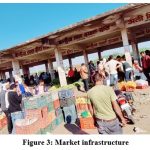 |
Figure 3: Market infrastructure |
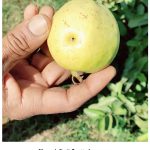 |
Figure 4: Fruit fly attack on guava |
Source: Field photographs taken during data collection
Market infrastructure is not good during season with mean rank 10.64 and low temperature during ripening of fruits with mean rank 10.54 were recognised as moderately important factors for post-harvest losses in guava. As in Sawai Madhopur district there was no proper market structure available where farmers could sell their produce. There was a very destitute structure made by the government away from the city and the traders involved in buying of guava charging a huge money for loading and unloading of fruits from farmers as shown in figure 3. Further, mechanical injury in fruits (Mean Rank 9.39), bad transportation (Mean Rank 8.99), bird damage in guava (Mean Rank 8.66) and inappropriate collection material (Mean Rank 7.75) were also responsible for the post-harvest losses in guava. The bad handling of fruit by farmers and labours during collection, packaging, transportation, loading and unloading causes mechanical injury to the fruits. Various birds like parrots, sparrows and others eat guava even during immature condition and after ripening also which further damages the guava that contribute post-harvest losses. The farmers pluck the fruits into buckets which was not appropriate collection material for fruits.
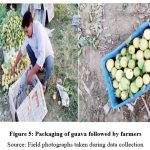 |
Figure 5: Packaging of guava followed by farmers |
Source: Field photographs taken during data collection
Animal’s damages the Fruits with mean rank (Mean Rank 6.85), inappropriate harvesting method (Mean Rank 6.68), physiological disorder (Mean Rank 6.40), not timely harvesting of fruits (Mean Rank 5.71), high humidity (Mean Rank 5.48) and poor packaging material (Mean Rank 5.20) identified as less important factors responsible for post-harvest losses. Majority of farmers pluck the fruit by hands and various times fruit is released from hands and directly falls on ground from a height due to which fruits are damaged. The physiological disorders in guava crops have been observed to be affected by deficiency of zinc. Affected fruits dry up and fall to ashes. The fruits not timely harvested due to unavailability of labour during season causes losses in fruits because the fruits become overripe and fall down by themselves to the ground. High humidity also causes loss to fruits and poor packaging material such as open trolley containing crates of fruits which further damages due to rainfall and friction between fruits due to availability of space between fruits as shown in figure 5.
 |
Figure 6: Standard harvesting equipment for guava. |
Source: Field photographs taken during data collection
Farmers were recommended to use the appropriate harvesting equipment for the harvesting of guava as shown in figure 6. So that the fruits are properly harvested and direct falling of fruits to the ground can be avoided.
The main factors that are responsible for the post-harvest losses in guava were improper sorting and grading. To avoid these factors farmers should give proper time for sorting and grading of fruits. The Department of Horticulture should conduct some training programs to create awareness among farmers to overcome these factors which are responsible for post-harvest losses. Similar results were obtained in the study of Gill, 201519.
Conclusion
It was concluded from results that the overall post-harvest losses in guava at district level were 14.05 per cent which were comparatively higher than NABCONS study on post-harvest losses. The quantity loss (1.91%) during collection & transportation to storage house operation was due to inappropriate collection material and falling of overripe fruits. The quantity loss (7.50%) during sorting was because fruit was attacked by fruitfly, diseased fruits and overripe fruits which were sorted out during sorting operation. The quantity loss during grading was due to inappropriate grading by labours. There were three types of grading done by farmers of study area through manual operation that was A, B, C type and the fruits were taken out which did not fall in these types of grading categories. The quantity loss during transportation was due to jerk of vehicle, overloading and friction between fruits. Inappropriate sorting & grading, heavy rainfall, insect infestation, disease infection and market infrastructure were the major contributing factors for the post-harvest losses in guava. Farmers were recommended to use the appropriate harvesting equipment for the harvesting of guava. To overcome the major factors farmers should give proper time for sorting and grading of fruits. The Department of Horticulture should conduct some training programs to create awareness among farmers to overcome these factors which are responsible for post-harvest losses.
Conflict of Interest
The authors do not have any conflict of interest.
Funding Sources
The author(s) received no financial support for the research, authorship, and/or publication of this article.
References
- KVK Network. Package of Practices of GUAVA. Krishi Vigyan Kendra Knowledge Network. (n.d.). https://kvk.icar.gov.in/API/Content/PPupload/k0202_44.pdf. Accessed on 12/06/2023.
- Area and Production of Horticulture Crops: All India. Gurugram, Haryana: National Horticulture Board. 2018; 1-3. doi: http://nhb.gov.in/statistics /State_Level/2017-18-(Final).pdf
- Katumbi J. N., Imungi J. K., Abong G. O. Harvesting, postharvest handling, hygiene knowledge and practices of guava fruit farmers: A comparative study of two counties of Kenya. African Journal of Food Science (2021); 15(5): 177-189, DOI: 10.5897/AJFS2021.2079.
CrossRef - Saini H. Sushma S. Post–Harvest Management in Guava. Agrobios Newsletter (2019); XVII (10): 79-80.
- Mitra, S. K., Irenaeus, T. K. S., Gurung, M. R., & Pathak, P. K. Taxonomy and importance of Myrtaceae. In III International Symposium on Guava and other Myrtaceae. (2012, April); 959: 23-34
CrossRef - Nguyen T. T., Bhandari B., Cichero J. Prakash S. A comprehensive review on in vitro digestion of infant formula. Food Research International. (2015); 76: 373-386. doi: 10.1016/j.foodres.2015.07.01
CrossRef - Kamsiati, Elmi. “Postharvest handling practices in maintaining quality and shelf life of guava (Psidium guajava).” Proceedings of the International Conference on Agricultural Postharvest Handling, and Processing, Jakarta, Indonesia. 2013.
- Macnish A. J. Crop Post-Harvest: Science and Technology–Perishables. Edited by D. Rees, G. Farrell and J. Orchard. Experimental Agriculture, 48(4), Chichester, UK: Wiley-Blackwell.
- Paull R. E., Ketsa S. Papaya: Postharvest quality maintenance guidelines. Fruit, nut and beverage crops. (2014): 2-4.
- Rawan S., Bibi F., Khan N., Khattak A. M., Shah Z., Iqbal A. Postharvest Life of Guava (Psidium guajava L.) Varieties as Affected by Storage Intervals at Room Temperature.” Pakistan Journal of Agricultural Research (2017); 30(2): 1555-161.
CrossRef - Gardas B. B., Raut R. D., Narkhede B. Evaluating critical causal factors for post-harvest losses (PHL) in the fruit and vegetables supply chain in India using the DEMATEL approach. Journal of Cleaner Production. (2018); 199, 47-61. Doi: https://doi.org/10.1016/j.jclepro.2018.07.153
CrossRef - Yadav A., Kumar N., Upadhyay A., Fawole O. A., Mahawar M. K., Jalgaonkar K., Mekhemar M. Recent advances in novel packaging technologies for shelf-life extension of guava fruits for retaining health benefits for longer duration. Plants (2022); 11(4): 547. https://doi.org/10.3390/plants11040547
CrossRef - Area and Production of Horticulture Crops: All India. Gurugram, Haryana: National Horticulture Board. 2018; 1-3. doi: http://nhb.gov.in/statistics/State_Level/2017-18-(Final).pdf
- Kumari M., Bairwa S. J., Meena L. K., Rahman M. Availability and postharvest losses of fruits and vegetable in Bihar: Economic analysis. International Journal of Agricultural Invention (2017); 1(2): 207-212. DOI: 10.46492/IJAI/2016.1.2.15
CrossRef - Study to Determine Post-Harvest Losses of Agri Produces in India. (2020); 2: 12-18.
- Gajanana, T. M., Murthy, D. S., Sudha, M., Saxena, A. K., Rao, D. S., Dakshinamoorthy V. Post-harvest loss and marketing of fruits-economic analysis of pink flesh guava in local and distant markets in India. Journal of Horticultural Sciences. (2019); 14(1): 1-6.
CrossRef - Gill R. Post-Harvest Decision Making Pattern and Marketing Behaviour of Peri Urban Farmers. (Doctoraldissertation). New Delhi: Indian Agricultural Research Institute. (2015). 10-15
- Papargyropoulou E., Lozano R., Steinberger J., Wright N., Ujang Z. The food waste hierarchy as a framework for the management of food surplus and food waste. Journal of Cleaner Production. (2014); 76: 106-115. DOI: 10.1016/j.jclepro.2014.04.020
CrossRef - Gill R. Post-Harvest Decision Making Pattern and Marketing Behaviour of Peri Urban Farmers. (Doctoraldissertation). New Delhi: Indian Agricultural Research Institute. (2015). 10-15.