
Introduction
According to FAO (2022) data, the production of cotton in the world increased from about 41.9 mt in 2018 to 45.4 mt in 2019. Out of these values, Asia as a continent contributed heavily by producing about 27.3 mt in 2018 and 29.5 mt in 2019. From the contribution made by Asia, India dominated by producing about 9.9 mt in 2018 and 12.5 mt in 2019, which made India the largest producer of cotton in 2018 and 2019. As elaborated by Meyer (2021), the USDA cotton forecasts for 2021-22 revealed that the world cotton production was projected at 119.4 million bales, on a harvested area of 33.35 million hectares with a yield of 779 kg per hectare. From their projections, India was projected to produce 29 million bales of cotton on a harvested area of 13 million hectares with a yield of 486 kg per hectare, followed by China, projected to produce 26.75 million bales of cotton on a harvested area of 3.1 million hectares with a yield of 1,879 kg per hectare. Shahbandeh (2022) however revealed at statista.com that in 2021/2022, China emerged as the leading cotton producer worldwide, producing around 5.88 million metric tonnes, followed by India and USA with 5.33 and 3.82 million metric tonnes respectively. COCPC (2022) reported that the area under cotton cultivation worldwide is around 33.48 million hectares in the crop year 2020-2021, with a production of around 26.36 million tonnes and productivity of about 451 kgs per hectare. Out of these values, India has the major cropped area about 12.35 million hectares of cotton farming which is representing around 37% of the world’s area under cotton cultivation. India also accounts for around 22% of the production of cotton worldwide which is quantified as 5.79 million tonnes, being the second largest cotton producer after China. The productivity of cotton in India in the year 2021-2022 is 469 kgs per hectare contrasting with the world average productivity of around 787 kgs/hectare. This study intends to reveal the growth of the production of cotton during the study period (1959-1960 to 2018-2019). In addition, the import-export scenario of cotton in India is highlighted. In 2020, the US was the top exporter of this crop in the world, with a percentage share of 46.1% of the global export of 9.27 million metric tonnes valued at 14.31 billion dollars. The second powerhouse of cotton export was Brazil with a percentage share of 22.6%, followed by others (rest of the world) with a percentage share of 19.4%, where India was the fourth largest exporter of cotton with a percentage share of 10.1%, Benin and Greece completed the top six of cotton export across the globe. In the same year, cotton imports across the globe were recorded at 8.34 million metric tonnes which amount to 13.69 billion dollars where China was the largest importer of cotton with a percentage share of 26%, importing heavily from the United States, Brazil, India, Australia, and Sudan (Mordor Intelligence, 2022). The export scenario took a different shape as India exported cotton worth about 10 billion dollars representing 16.6% of the cotton export across the globe, which was the second largest country in terms of export with China as the first, exporting cotton worth 12.4 billion dollars representing 20.5% of the total cotton export across the globe, and the United States as the third largest country with cotton export worth 7.2 billion dollars (11.8 % of the total cotton export across the globe). India emerged as the largest country earning the first position in terms of trade surplus from cotton (i.e. the surplus between the value of exported cotton and import purchases) with a net export surplus worth 9.3 billion dollars, followed by the United States of a net export surplus of 6.2 billion dollars. The scenario of cotton import and export for the study period (2008-2009 to 2018-2019) is in table 1.
Table 1: Cotton Import Scenario of India, 2008-2009 to 2018-2019
|
Year |
Import |
Export |
||
|
Quantity (lakh bales of 170 kgs) |
Amount (Rs.crores) |
Quantity (lakh bales of 170 kgs) |
Amount (Rs.crores) |
|
|
2008-09 |
10.00 |
1377.80 |
35.00 |
3837.13 |
|
2009-10 |
6.00 |
1195.64 |
83.00 |
10270.21 |
|
2010-11 |
2.38 |
1709.11 |
76.50 |
14483.31 |
|
2011-12 |
7.51 |
1059.20 |
129.57 |
23488.59 |
|
2012-13 |
14.59 |
2057.77 |
101.43 |
17462.87 |
|
2013-14 |
11.51 |
2746.16 |
116.96 |
23153.24 |
|
2014-15 |
14.39 |
2848.50 |
57.72 |
9499.87 |
|
2015-16 |
22.79 |
4230.00 |
69.07 |
11434.80 |
|
2016-17 |
30.94 |
7268.00 |
58.21 |
11676.00 |
|
2017-18 |
15.80 |
4224.84 |
67.59 |
13976.71 |
|
2018-19 |
35.37 |
8339.26 |
43.55 |
9502.72 |
Source: COCPC.2022
According to ICAC (2022), India is one of the top countries concerning cotton consumption, consuming about 5,698.25 (‘000’ metric tonnes) out of the 26,158.17 (‘000’ metric tonnes) total cotton consumption across the globe which represents 21.78% of the world’s total. Among the various cotton-growing states in India, Gujarat state of India has dominated in the cotton production in the country. Gujarat is known as a state of the textile industry that generates a large amount of textile revenue for the country. This accounts for the dominance of Gujarat in cotton production in the country. Many works and data sources over the years have revealed that Gujarat is the prominent growing state in India that contributes about 30 percent of the total production of cotton in India. Maharashtra, Andhra Pradesh, Karnataka, and Haryana complete the top five cotton-producing states in India. The table below shows the top 10 largest cotton-producing states in India (2022).
Table 2: Top 10 cotton-producing states in India
|
Position |
State |
Quantity (lakh bales)/annum Rounded figure. |
|
1 |
Gujrat |
95 |
|
2 |
Maharashtra |
89 |
|
3 |
Andhra Pradesh & Telangana Combined |
68-70 |
|
4 |
Karnataka |
21 |
|
5 |
Haryana |
20-21 |
|
6 |
Madhya Pradesh |
20-21 |
|
7 |
Rajasthan |
17-18 |
|
8 |
Punjab |
9-10 |
|
9 |
Tamil Nadu |
5-6 |
|
10 |
Orissa |
3 |
Source: Trendrr.net (2022)
Data and Methodology
The study was based on secondary data. The study period which spans 1999-2019 was divided into three separate periods with each period spanning across twenty (20) years intervals: period I (1959-1960 to 1978-1979), period II (1979-1980 to 1998-1999) and period III (1999-2000 to 2018-2019). The growth rate analysis was performed for the respective periods as well the entire period of the study. The sources data and information were collected from the Ministry of Agriculture, Food and Agriculture Organization (FAO), Cotton Corporation of India (www.cotcorp.ind.com), and Directorate of Economics and Statistics, DA&FW. The correlation coefficient was obtained and justified graphically by a scatter plot to show the logical relationship between the area, production, and yield of cotton in India. The growth rate was estimated by the Compound Annual Growth Rate (CAGR) method. The component analysis revealed the interaction effect of the area, farm harvest, price, and yield of cotton in this study. The stability or variability of cotton production and yield has also been measured by CV during the study period. The advantage or disadvantage of India over other cotton-producing nations in cotton export was identified by the RCA- Revealed Comparative Advantage approach.
Growth Rate
The CAGR which is commonly used in business and investing contexts was used on the time series data to analyze the growing efficiency of production in India for the selected period. It is reviewed in the literature that, many authors apply the compound growth rate to describe the rate at which the production of crops grows within a specified period (Kumari and Ahlawat, 2021; Sharma et.al., 2017; Kumar et al., 2018). The compound growth rate was computed from the relation below:
Growth rate = {antilog (β) -1} 100
Y = ABX
Log Y= log A+ X log B
If Log Y= y, log A = α and Log B = β
Then Y = α + βX
Where α is the intercept parameter, Y (dependent variable) takes the values of the production, area, or yield of cotton of the specified period and X is the time (independent variable). The value of β *(regression coefficient) obtained from the Ordinary Least Square (OLS) method, determines the amount of change in Y values for the change in time X. (Sharma et al., 2017). Future predictions on the production were also made from the mathematical model formulated. Forecasting using regression involves using a regression model to predict future values of the dependent variable based on historical data of both the dependent and independent variables. Regression-based forecasting is commonly used when there is a relationship between the variables and when past trends can provide insights into future behavior.
Component analysis
The growth rate analysis revealed the general pattern of production growth. To show the impact of area and yield on change in the output of cotton in duration of the study, the component analysis was used. This was obtained from the relation below:
change in production= PoAoΔY (Yield effect) + PoYoΔA (Area Effect) + AoYoΔ P (Price Effect) + PoΔAΔY (Area & Yield Effect) + AoΔPΔY (Price & Yield Effect) + YoΔPΔA (area & Price) + ΔAΔYΔP (Interaction of area, yield, and Price)
Where Ao =Base year Area
Po = Base year Price
Yo= Base year Yield
Δ= Change (Current Year-Base Year).
Revealed Comparative Advantage (RCA)
The Export Performance Ratio (EPR) of India in cotton compared to the world was identified in this study by the RCA approach. This index revealed the advantage or disadvantage India has in cotton. The RCA is the ratio of the nation’s exports to {\displaystyle {\frac {E_{cp}}{\sum _{p’}E_{cp’}}}} the proportion of world exports of the product under consideration. Hence this is defined in our setup as;
![]()
E. ind = proportion of India’s export in cotton
E. w = proportion of cotton export in the world
From this relation, India is “revealed” as comparatively advantaged if RCA > 1 and comparatively disadvantaged if RCA < 1.
Results and Interpretation
In describing the association between area and production, yield and production as well as area and yield, Pearson’s product-moment correlation was used. The correlation coefficient of area and production of the crop under study in India over the selected period was 0.923 which was significant with a 95% confidence level, which indicates that increment in the area positively affects cotton production in India. The correlation coefficient of yield and production of cotton in India over the study period (1959-1960 to 2018-2019) is found to be 0.975 which is significant with a 95% confidence level. Hence increment in yield increases cotton production in India. Also, the correlation of area and yield was obtained as 0.828 with the same interpretation and conclusion as the previous comparison. The t-test statistic was used for a test at a 5% significance level, as shown in Table 3.
Table 3: Correlation between APY of cotton
|
Pearson’s product-moment correlation |
T |
p-value |
|
|
Area Vs Production |
0.923 |
18.255 |
2.2e-16 |
|
Yield Vs Production |
0.975 |
33.47 |
2.2e-16 |
|
Area Vs Yield |
0.828 |
11.25 |
3.302e-16 |
The above association is also shown graphically in figure 1. From the figure, it is observed that the points have a greater density around the straight line in all the three graphs. This implies that yield and production have a linear association (linear correlation), therefore increase in production increases yield, and the same interpretation and conclusion applies to area and production as well as area and yield.
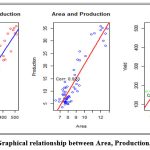 |
Figure 1: Graphical relationship between Area, Production, and Yield |
In the first four decades, it was observed that the cropped area in India increased from 7.30 million hectares during 1959-60 to 9.34 million hectares during the year 1998-99. Till the 1970s, the country used to import cotton in huge quantities to the tune of 8.00 to 9.00 lakh bales per year. The intensive cotton production program through the Central Government’s Five-Year Plans in the mid-70s led to an increase in the area under cotton and the planting of hybrid varieties and the country has since moved towards self-sufficiency in cotton production. Since the launch of the Technology Mission on Cotton by the Government of India in 2000, significant achievements have been made in increasing the yield and production of native cotton and BT cotton hybrids, etc. The per hectare yield which was stagnant at around 300 kg/ha for so many years, improved to 506 kg/ha in 2017-18 and touched the level of 566 kg/ha in 2013-14. Although the yield per hectare is still lower than the world average of about 765 kg per hectare, the essential deviations attractive place in the cotton farming segment in the country will carry the existing yield level to the world average in the near future. It was observed that the cropped area of cotton in India increased by 11.23 and 14.88 percent in the first and second study periods respectively as a result of the area expansion policy. The percentage change of production and productivity in the first period was found to be 116.3 and 94.19 percent respectively, and 60.65 and 40 percent respectively in the second period. In the last period, area, production, and productivity showed increments of 44.78, 143.19, and 68 percent respectively. The above indicates that productivity increased greatly in the second period by 94.19 percent. The percentage change is not regarded as a sufficient measure since it only considers two values in the period, which gives the relative change in size across the period under consideration, hence the compound annual growth rate, which utilizes all values across the period and represents the average amount of change per annum across the period under consideration. Table 4 shows the area (in million hectares), production (in million tonnes), and yield (in kilogram per hectare) of cotton in the study period (1959-60 to 2018-19) in India as given below.
Table 4: Area, Production, and Productivity of Cotton in India (1959-1960 to2018-2019)
|
Period |
Area |
Prodn |
Yield |
Year |
Area |
Prodn |
Yield |
Year |
Area |
Prodn |
Yield |
|
1959-60 |
7.30 |
3.68 |
86 |
1979-80 |
8.13 |
7.65 |
160 |
1999-00 |
8.71 |
11.53 |
225 |
|
1960-61 |
7.61 |
5.60 |
125 |
1980-81 |
7.82 |
7.01 |
152 |
2000-01 |
8.53 |
9.52 |
190 |
|
1961-62 |
7.98 |
4.85 |
103 |
1981-82 |
8.06 |
7.88 |
166 |
2001-02 |
9.13 |
10.00 |
186 |
|
1962-63 |
7.73 |
5.54 |
122 |
1982-83 |
7.87 |
7.53 |
163 |
2002-03 |
7.67 |
8.62 |
191 |
|
1963-64 |
8.22 |
5.75 |
119 |
1983-84 |
7.72 |
6.39 |
141 |
2003-04 |
7.60 |
13.73 |
307 |
|
*1964-65 |
8.37 |
6.01 |
122 |
1984-85 |
7.38 |
8.51 |
196 |
2004-05 |
8.79 |
16.43 |
318 |
|
1965-66 |
7.96 |
4.85 |
104 |
1985-86 |
7.53 |
8.73 |
197 |
2005-06 |
8.68 |
18.50 |
362 |
|
1966-67 |
7.84 |
5.27 |
114 |
1986-87 |
6.95 |
6.91 |
169 |
2006-07 |
9.14 |
22.63 |
421 |
|
1967-68 |
8.00 |
5.78 |
123 |
1987-88 |
6.46 |
6.38 |
168 |
2007-08 |
9.41 |
25.88 |
467 |
|
1968-69 |
7.60 |
5.45 |
122 |
1988-89 |
7.34 |
8.74 |
202 |
2008-09 |
9.41 |
22.28 |
403 |
|
1969-70 |
7.73 |
5.56 |
122 |
1989-90 |
7.69 |
11.42 |
252 |
2009-10 |
10.13 |
24.02 |
403 |
|
1970-71 |
7.61 |
4.76 |
106 |
1990-91 |
7.44 |
9.84 |
225 |
2010-11 |
11.24 |
33.00 |
499 |
|
1971-72 |
7.80 |
6.95 |
151 |
1991-92 |
7.66 |
9.71 |
216 |
2011-12 |
12.18 |
35.20 |
491 |
|
1972-73 |
7.68 |
5.74 |
127 |
1992-93 |
7.54 |
11.40 |
257 |
2012-13 |
11.98 |
34.22 |
486 |
|
1973-74 |
7.57 |
6.31 |
142 |
1993-94 |
7.32 |
10.74 |
249 |
2013-14 |
11.96 |
35.90 |
510 |
|
1974-75 |
7.56 |
7.16 |
161 |
1994-95 |
7.87 |
11.89 |
257 |
2014-15 |
12.82 |
34.80 |
462 |
|
1975-76 |
7.35 |
5.95 |
138 |
1995-96 |
9.04 |
12.86 |
242 |
2015-16 |
12.29 |
30.01 |
415 |
|
1976-77 |
6.89 |
5.84 |
144 |
1996-97 |
9.12 |
14.23 |
265 |
2016-17 |
10.83 |
32.58 |
512 |
|
1977-78 |
7.87 |
7.24 |
157 |
1997-98 |
8.87 |
10.85 |
208 |
2017-18 |
12.59 |
32.81 |
443 |
|
1978-79 |
8.12 |
7.96 |
167 |
1998-99 |
9.34 |
12.29 |
224 |
2018-19 |
12.61 |
28.04 |
378 |
|
Percentage Change |
11.23 |
116.30 |
94.19 |
Percentage Change |
14.88 |
60.65 |
40 |
Percentage Change |
44.78 |
143.19 |
68 |
Compound Annual Growth Rate
The annual growth efficiency of cotton for the selected period is presented in table 5. It is observed that there is an annual decline in the cropped area of cotton by 0.19% during the first period, however, this is not statistically significant. In the same period, the rate of growth production and productivity of the selected crop in India improved significantly at a rate of 2.10% and 2.29% per annum. During the second and third periods of the study, it is observed that the cropped area improved significantly at rates of the 0.72% and 2.68% respectively per annum. This may be attributed to government interventions such as the area expansion policy. The production increased significantly at a rate of 3.55% and 7.52% per annum in the second and third periods respectively. During periods II and III, the growth rate of productivity of cotton increased significantly by 2.81% and 4.72% respectively. The complete period (1959-2019) exposed that the growth rate of productivity of cotton in India improved significantly by 2.75% per annum, which occurred due to the significant increase in cropped area by 0.72% per annum and production by 3.50% per annum. The results from the study indicate that the annual production and productivity of cotton are significantly increasing continuously in India with positive growth during the study period. Similar results were also observed in the study conducted by Narala and Reddy 2011, Shaikh and Joshi, 2013 Shanker and Naidu, 2016, More et.al. 2017, Meena et. al. 2022, Sharma et al. 2022, Sharma and Burark 2021, and Meera and Sharma 2015 which mentioned that there is a significantly increased in cotton growing area with yield. From the various models formulated in the study, the forecast for the production of cotton in India for 2022-23, 2023-24, and 2024-25 is revealed to be 34.34,35.54, and 36.78 (in million tonnes) respectively. The forecast for productivity revealed for the year 2022-23, 2023-24, and 2024-25 are 536.11, 550.87, and 566.03 (in kilogram per hectare) respectively.
Table 5: Compound Growth Rates of Area, Production, and Yield of Cotton in India
|
Time |
Area |
Production |
Yield |
|
I (1959-79) |
-0.19** |
2.10* |
2.29 * |
|
II (1979-99) |
0.72** |
3.55* |
2.81* |
|
III (1999-2019) |
2.68* |
7.52* |
4.72* |
|
Overall (1959-2019) |
0.72* |
3.50* |
2.75* |
* and ** indicate significance level of values at P=0.01 and 0.05, respectively
From the table 6 It is observed that the expected production and productivity increase continuously without decline for the period 2022-23 to 2026-27 by the expected growth rates of 3.495% and 2.753% respectively per annum, which is equivalent to that of the overall study period.
Table 6: Forecast of Production and Productivity of Cotton with CAGR for 2022-23 to 2026-27
|
Period |
Production (million tons) |
Yield (kg per hectare) |
|
2022-23 |
34.34 |
536.11 |
|
2023-24 |
35.54 |
550.87 |
|
2024-25 |
36.78 |
566.03 |
|
2025-26 |
38.07 |
581.62 |
|
2026-27 |
39.40 |
597.63 |
|
CAGR (%) |
3.49 |
2.75 |
The Component Analysis of Cotton Production in India
The impact of the components on the variation in the production of cotton in India for the selected period was revealed in Table 7. From the table, the impact of Yield, Area, Price, Area & Yield, Price & Yield, Area & Price, and Interaction (combination of all components) on cotton production in India for the study period were recorded as 7.94%, 37.08%, 3.69%, 26.97%, 2.68%, 12.53%, and 9.11% respectively. This shows that all the components contribute positively towards cotton production in the country. However, the yield or productivity has a higher impact on the production of cotton in India contributing 37.08% during the overall study period. The same scenario was revealed across all sub-periods of the study. Meena et al. 2022 and Sharma et al. 2022) observed similar findings in their study crops. Hence, the component analysis reveals that the development of the production of cotton is mainly affected by the yield of the crop.
Table 7: The Component Analysis of Cotton Production in India
|
Period |
Area Effect (%) |
Yield Effect (%) |
Price Effect (%) |
Area & Yield (%) |
Area & Price (%) |
Price & Yield (%) |
Interaction Effect (%) |
|
I (1959-79) |
10.21 |
85.58 |
-2.50 |
9.61 |
-0.28 |
-2.36 |
-2.65 |
|
II (1979-99) |
23.44 |
62.99 |
2.61 |
9.37 |
0.39 |
1.05 |
0.16 |
|
III (1999-2019) |
18.96 |
28.79 |
16.19 |
12.89 |
7.25 |
11.01 |
4.93 |
|
Overall (1959-19) |
7.94 |
37.08 |
3.69 |
26.97 |
2.68 |
12.53 |
9.11 |
Export Competitiveness (RCA)
The Export Performance for the export of cotton from India are accessible in Table 8 and revealed that from 2003 to 2011 the cotton remained as an efficient export commodity with better competitiveness. RCA values were found to be more than one, which specifies that the share of cotton export to total agricultural export in India is more than that of the world’s combined data. From the table the RCAs are below unity from 2000 to 2002 and 2012 to 2018. The ratio has been growing from 2003 to 2011. There has been a significant increase in the risk associated with cotton from 0.17 in 2000 to 9.58 in 2007.
Table 8: RCA and RSCA for cotton crop in selected period
|
Year |
Cotton Exports |
|
|
RCA |
RSCA |
|
|
2000 |
0.1734 |
-0.7044 |
|
2001 |
0.0692 |
-0.8706 |
|
2002 |
0.1283 |
-0.7726 |
|
2003 |
1.5357 |
0.2113 |
|
2004 |
1.5570 |
0.2178 |
|
2005 |
4.5348 |
0.6386 |
|
2006 |
7.3932 |
0.7617 |
|
2007 |
9.5872 |
0.8111 |
|
2008 |
2.8621 |
0.4822 |
|
2009 |
2.6915 |
0.4582 |
|
2010 |
2.4635 |
0.4225 |
|
2011 |
2.4315 |
0.4172 |
|
2012 |
0.9517 |
-0.0247 |
|
2013 |
0.3938 |
-0.4349 |
|
2014 |
0.3513 |
-0.4801 |
|
2015 |
0.8678 |
-0.0708 |
|
2016 |
0.8350 |
-0.0899 |
|
2017 |
0.8989 |
-0.0532 |
|
2018 |
0.8392 |
-0.0874 |
The RCA grieves from the asymmetry problem because the net RCA is not on either side of unity, although if a country is not said to be exclusive to a given region, the index ranges from zero to one, while the value of the determinant ranges from one to infinity. India’s exposure to the RSCA index gives clear indications of risk aversion and India’s risk aversion as a whole has been increasing during the period relative to the index. The RSCA value in 2012 was -0.02 to -0.08, which would be attributed to an increase in domestic demand and a reduction in ambiguity.
Conclusion and Policy Implication
The outcomes evidently express that the performance of production and productivity of cotton in India increased from periods 1 to 3. The study period revealed that the rate of production growth of cotton in India increased significantly by 3.5 percent annually, which is because the productivity rate increased significantly by 2.75 percent per annum, whereas the area also increases significantly at a rate of 0.72 percent annually. The annual production of cotton is increasing continuously in the country and showed encouraging growth in the selected period especially as the increase in production came from the highest rate of increase in productivity, implying technology-led growth. During period 3, the growth rate of production was high as compared to the second period due to the technology mission on cotton implemented. The relative contribution of area and price effect was positive with high output growth of cotton due to the development of many policies related to area extension and price policy by the government. The value of RSCA was from -0.02 in 2012 to -0.08 which will be attributed to the decrease in exports due to the upsurge in domestic demand and low export prices. For example, the development potential of land (acreage effect) is limited owing to the scarce supply of water resources. If current yield trends continue, the increase in crop production will increase over time. In conclusion, supporting farmers to increase cotton production and export can be a viable strategy for economic development, but it requires a balanced approach that considers social equity, and international trade regulations. Government policies should aim to create an enabling environment that fosters growth while addressing potential challenges in the process.
Conflict of Interest
There is no conflict of interest.
Funding Sources
There are no funding sources.
References
- Agricultural Statistics at a Glance (2021), Ministry of Agriculture &Farmers Welfare, Department of Agriculture, Cooperation & Farmers Welfare, Directorate of Economics & Statistics, Govt of India.
- G. L. Meena, Latika Sharma, Kailash Chand Bairwa, Phool Chand Meena, Hemant Sharma (2022) Growth and variability in sorghum production in Bhilwara district vis-à-vis Rajasthan. AMA, Agricultural Mechanization in Asia, Africa and Latin America.53(6):8829-8837
- Hemant Sharma and S.S. Burark (2021). Measurement of Growth in Total Factor Productivity of Gram in Rajasthan. International Journal of Agriculture and Statistical Science 17 (1): 261-266.
- Hemant Sharma, S.S. Burark, Hari Singh, Latika Sharma, G.L. Meena (2022) Growth of Rapeseed & Mustard Output in Rajasthan: A Component Analysis. AMA, Agricultural Mechanization in Asia, Africa and Latin America.53 (4):7251-7256.
- Josily S., Basavaraja H., Pushpanjali1 & Rejani R. (2015). Production, Growth and Export Competitiveness of Raw Cotton in India – an Economic Analysis. Agricultural Research & Technology. 1(1): 555551. DOI: 10.19080/ARTOAJ.2015.01.555551.
CrossRef - Kumari P. & Ahlawat M. (2021). Growth Efficiency in Production of Major Crops in Haryana: A District Level Study. Research and Reviews Journal of Agriculture and Allied Sciences. Vol. 10(4):1-28.
- Meena, Murlidhar & Khunt, K. & Meena, Hari & khorajiya, H. (2019). Assessing export competitiveness of Indian groundnut. Agricultural Economics Research Review. 31. 221-230. 10.5958/0974-0279.2018.00039.3.
CrossRef - Meera and Hemant Sharma (2015) “Growth and Instability of Wheat Production in Rajasthan” Indian Journal of Economics and Development. 11(4): 945-950.
CrossRef - More, S. S., Singh, N. and Leua, A. (2017). Performance of cotton in Gujarat: A long term critical analysis. Journal of Cotton Research and Development, Vol.31(1), 157-163.
- Narala, A. and Reddy, A.R. (2011). Analysis of growth and instability of cotton production in India. World Cotton Research Conference-5, Mumbai, India, 449-453.
- Pavithra S, Mishra R.R., Gaware Utkarsha Pramod, Baviskar P.P., Kumari K., & Ahmad N. (2022). Growth and instability in production and trade of cotton in India: A macro-level approach. The Pharma Innovation Journal; SP-11(2): 304-307.
- Prabha R. (2022). An Analysis of Growth Performance of Groundnut Crop in India. International Journal of Research Publication and Reviews, 3(6):1474-1478.
- Sankar, S.A., and Naidu, V.B. (2016). Growth and instability of cotton crop in major cotton growing states in India. International Journal of Advanced Educational Research, Vol.1(5), 15-19.
- Shaikh, I. A., and Joshi, M.B. (2013). Analysis of instability and growth rate of cotton in three district of Marathwada. International Journal of Statistika and Mathematica, Vol. 6(3), 103-124.
- Sharma, H., Parihar T. B. and Kalpana K. (2017). Growth rate and Decomposition Analysis of Onion Production in Rajasthan State of India. Economic Affairs, 62(1):157 -161.
CrossRef - https://cotcorp.org.in/statistics.aspx?AspxAutoDetectCookieSupport=1
- FAO (2022). FAOSTAT https://www.fao.org/faostat/en/?#data/QCL
- OEC- (2022). https://oec.world/en/profile/hs/cotton?yearSelector1=tradeYear25.