


Introduction
Agriculture makes a significant contribution to economic growth and development.1 It provides a substantial source of income for large group of small farmers in developing countries like India, where 85 percent of agricultural communities are small and marginal farmers.2 Cropping intensity and irrigation intensity are important components for accessing the agricultural progress in any region.3,4 These are two closely related agricultural indices used to measure the level of water and land-use intensification in a region.5 Cropping intensity reflects the cropping patterns and crop production, the crop diversity and rotation potential, farmer income opportunities, and rural employment.6,7 Irrigation intensity is equally important because it directly influences cropping intensity and crop productivity.8,9 Effective irrigation supports intensive cultivation by reducing dependence on rainfall and enabling farmers to grow more than one crop in a year. The availability and proper use of irrigation water have a significant impact on cropping intensity.10,11 Comprehensive studies on cropping intensity and pattern recognition are crucial goal for agricultural geographers since the concept of intensity is widely utilized in the literature to explain the spatial arrangement of agriculture.12 A value of 100 percent indicates single cropping, while above 100 percent suggest double or triple cropping, and a more intensive land use.13,14 In India, where agriculture is highly dependent on monsoon rainfall, irrigation acts as a critical physical input in modern farming. It plays a major role in shaping cropping patterns across different regions and determining the overall agricultural structure.15 Several scholars argue that irrigation facilities of any region fundamentally determined cropping structure and land-use decisions.16-18 Literature on cropping intensity, irrigation intensity, and their spatial correspondence is predominantly available at broader scales; sub-national, national, and global leaving a gap in district-level understanding essential for targeted agricultural development. Addressing this, the present study investigates the spatio-temporal variations in cropping intensity and irrigation intensity, along with their association, in twenty-one tehsils, of jammu district from 2015-16 to 2022-23.
Understanding the interrelationship between irrigation provisions and cropping intensity is therefore essential for evaluating the agricultural potential of any region.12 In addition to reflecting the current state of agricultural development, promoting drip irrigation as an efficient irrigation technology offers insightful recommendations for sustainable planning, resource utilization, and long-term rural prosperity.19-21 In this context, following objectives are discussed in the study:
- To identify Tehsil wise Cropping Intensity and Irrigation intensity of Jammu District.
- To analyse the changing trends in cropping and irrigation intensity and to quantify impact of irrigation on cropping intensity across tehsils of Jammu District.
- To map and interpret spatial residuals from the regression of cropping intensity on irrigation intensity for 2015–16 and 2022–23.
Material and Methods
The Jammu district is located in the north-western part of the country and in the southern region of Jammu and Kashmir UT. Geographically, Jammu district is situated between 32°-50″ and 33°-30″ north latitude and between 74º-24″ and 75º -18″ east longitude. It is bordered to the north by Katra and Pouni tehsils of Reasi, and partly by tehsils of district Rajouri and to its north east by Ramnagar tehsil of Udhampur district. Samba district is located in the east. Pakistan and Pakistan-occupied Kashmir territory are located in the south and west.22 Jammu district occupies an area of roughly 2342 km². The study area can be divided into four sub-micro regions based on physiography: Jammu Siwalik west, Chenab-Tawi Plains, Jammu Siwalik east and Jammu foothill plain. The Jammu district is situated in a sub-mountainous region at the foot of the Himalayan outer ranges. The altitude of the district ranges from 325 meters at Jammu to 1,207 meters at Kalidhar, near Chauki Chaura.23 The district has a humid subtropical climate with hot summer, a pronounced monsoon season and short, cool winter with a marked winter-dry regime. The district differs only in that it is located at the end of a mountain range. With an average temperature ranging from 24.9°C to 41.7°C and peaking at 47°C, May, June, and July, are the hottest months. The district receives 1246 mm of rain on average per year.24 January is the coldest month, with temperatures as low as 1.3°C. Most of the rainfall is caused by southwest monsoon, which occurs from late June to late September.25 The study area is drained by a number of rivers that originate in the middle Himalayas, including the Chenab, Tawi and Minawar Tawi rivers. Lithosol and alluvial soil are the two types of soil that are most commonly found in the district.26 According to the 2011 census, the total population of Jammu district was 1,529,958. One of the most populous district of Jammu and Kashmir and accounts for 12.6 percent of the total population of UT. According to revenue records, the district has a total area of 237024 ha, of which the net area sown is 99938 ha. 34256 hectares are uncultivated and barren, 15739 hectares are culturable wasteland, 1713 hectares are covered in various trees, 2763 hectares are permanently pastured, 7176 hectares are fallow, and 6325 hectares are currently fallow.27,28
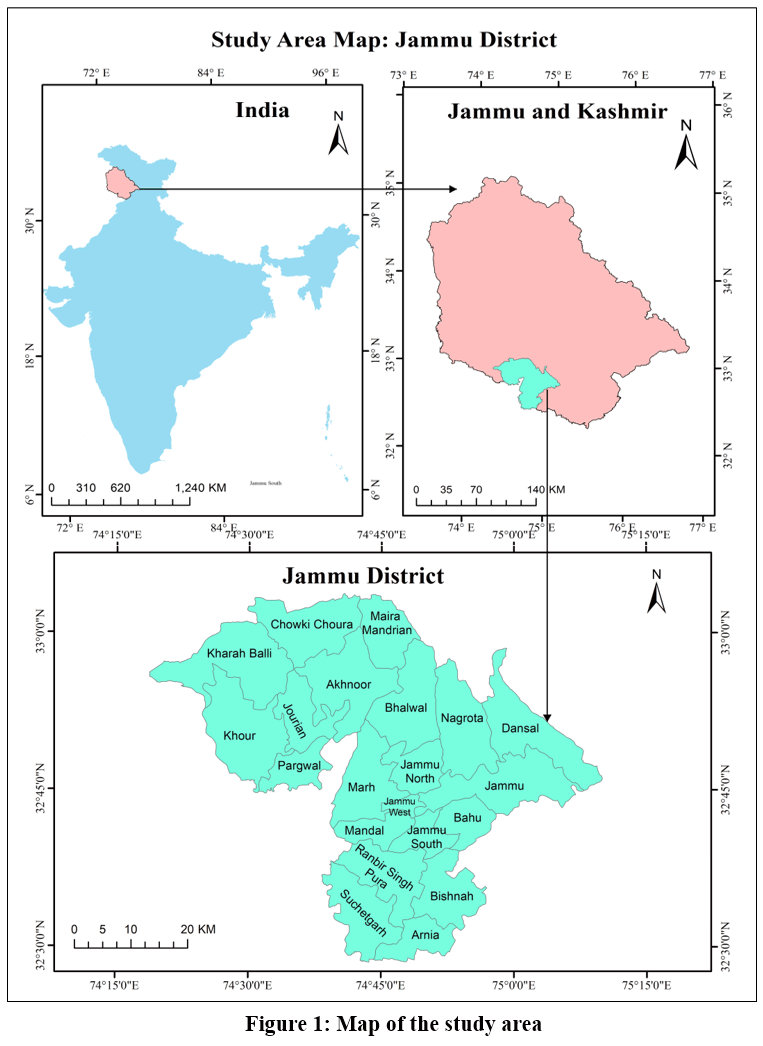 |
Figure 1: Map of the study area |
Source: Survey of India, 202531.
The present study is entirely based on the secondary database collected from the Goshwara Jinswara statements for crop Kharif and Rabi 2015-16 to 2022-23 of Jammu District Unpublished data issued by Assistant commissioner Revenue from the office of Deputy Commissioner Jammu, Jammu and Kashmir.29,30 Administrative Atlas is used for study area base maps. At present, there are twenty-one tehsils in Jammu district. This study is carried out in twenty-one tehsils in Jammu district of Jammu & Kashmir, for both the study period. Cropping intensity is estimated as the ratio of gross cropped area to net sown area.3,5 It has been calculated using the following formula.

The formula for calculating irrigation intensity is to divide the Gross irrigated area by the net cultivated area in a certain agricultural year, then multiply the result by 100.1,8

Regression Analytical method has been used to investigate the spatio-temporal relationship between cropping intensity and irrigation intensity5 in twenty-one tehsils of Jammu district. Based on the outcome of simple linear method (Regression analytical method), two residual maps (2015-16 and 2022-23) have been drawn based on residual values to illustrate how cropping and irrigation intensity relate to each other in the study area.
Results and Discussion
Spatio-temporal variations of cropping intensity in Jammu district:
Following the classification based on mean ± 0.5 SD of the cropping intensity into three groups
- Low cropping intensity zone (cropping intensity <171.08 percent i.e., <Mean -0.5SD);
- Moderate cropping intensity zone (cropping intensity 171.08 – 187.76 percent i.e., Mean ± 0.5 SD);
- High cropping intensity zone (cropping intensity >187.76 percent i.e., Mean + 0.5 SD);
A unique spatiotemporal variation of the cropping intensity illustrates the Figure 2. A mean cropping intensity index of 179.42 was recorded in Jammu district during 2015–16, with the spatial distribution of the index ranging from 122.6 (the lowest) in Jammu West tehsil to 200 (the highest) in Jammu tehsil (Fig. 2a; Table 1). Low cropping intensity was found in central and north- eastern tehsils of the study area which comprised of the tehsils of Dansal, Jammu North, Jammu West, Jammu South and Mandal (Fig. 2a and Table 1). A belt of moderate cropping intensity index, has been observed in a continuous belt from southern-east toward eastern region of study area and in patches in north-western and western parts of the Jammu district which includes the Arnia, Bahu, Bishna, Chowki Choura, Pargwal, Jourian, tehsils of the district. High cropping intensity has been recorded in a continuous chain from eastern towards west through northern part and in western parts of the study area which includes the tehsils of Akhnoor, Jammu, Bhalwal, Nagrota, Ranbir Singh Pura, Kharah Balli, Khour, Maira Mandrian, Suchetgarh and Marh. Furthermore, in the study area, the Cropping Intensity for 2022-2023 demonstrated clear spatial patterns, ranging from 138.01 in Jammu South tehsil to 200 in Suchetgarh tehsil (Fig. 2b and Table 1). It has been observed (Fig. 2b) that tehsils in low cropping intensity zone (cropping intensity <183.23 percent i.e., <Mean -0.5SD) have decreased drastically in central region of study area, and shows an increase in concentration in western part. On the other hand, number of tehsils in moderate cropping intensity zone (cropping intensity 183.23 – 196.62 percent i.e., Mean ± 0.5 SD) have increased remarkably, with around half of the tehsils falls in this category which clearly indicates that various govt schemes for the development of agriculture have performed better in these parts of study area. High cropping intensity zone (cropping intensity >196.62 percent i.e., Mean + 0.5 SD) have decrease drastically in western region due to urbanisation and expansion of Jammu–Poonch highway. Based on based on Mean and 1 SD of the change in cropping intensity have been divided into three groups: Low change cropping intensity zone (cropping intensity <10.50 percent i.e., <Mean); Moderate change cropping intensity zone (cropping intensity 10.50 – 21.10 percent i.e., Mean – 1 SD); High change cropping intensity zone (cropping intensity >21.10 percent i.e., > 1SD); and a separate category for negative change i.e., cropping intensity zone below zero. The Negative change in cropping intensity across the western part and in some patches in central and eastern region demonstrated the variability over time, tehsils include; Jammu, Jammu South, Pargwal, Khour, Kharah Balli, Akhnoor and Marh. A part from irrigation, Urban expansion, low productivity particularly in western region and secondary source of livelihood earning are other key factors of these variabilities. The low positive chang in cropping intensity in tehsil Bishnah, Bhalwal, Chowki Choura, Nagrota and Ranbir Singh Pura have although, well developed irrigation network but due to rapid land use change of agricultural land by the construction of ring road have impacted cropping intensity during this period. The cropping intensity index was moderate positive (cropping intensity 10.50 – 21.10 percent i.e., Mean – 1 SD) tehsils include; Arnia, Bahu, Jourian, Maira Mandrian and Suchetgarh as illustrated in Figure 2 and Table 1. The cropping intensity index varied highly positive across the north-east and central part of the district (Fig. 2c, Table 2). Tehsils with High positive change in cropping intensity index (cropping intensity >21.10 percent i.e., > 1SD) identified were Mandal, Jammu North, Dansal, and Jammu West increasing area under irrigation has also contributed in improvement of cropping intensity in these tehsils of study area.
Table 1: Jammu District: Tehsil Wise Cropping Intensity From 2015-16 to 2022-23.
|
S. No. |
Name of the Tehsils |
Gross Cropped Area |
Net Sown Area |
Cropping Intensity |
Change in Cropping Intensity 2015-16 to 2022-23 |
|||
|
2015-16 |
2022-23 |
2015-16 |
2022-23 |
2015-16 |
2022-23 |
|||
|
1 |
Akhnoor |
27796 |
25343 |
14168 |
13677 |
196.18 |
185.29 |
–10.89 |
|
2 |
Arnia |
31323 |
24480 |
18147 |
12810 |
172.6 |
191.1 |
18.5 |
|
3 |
Bahu |
2764 |
2384 |
1585 |
1277 |
174.3 |
186.69 |
12.39 |
|
4 |
Bhalwal |
38312 |
30580 |
19906 |
15369 |
192.46 |
198.97 |
6.51 |
|
5 |
Bishnah |
42928 |
40052 |
24643 |
21774 |
174.19 |
183.94 |
9.75 |
|
6 |
Chowki Choura |
9212 |
8135 |
5003 |
4209 |
184.1 |
193.28 |
9.18 |
|
7 |
Dansal |
8384 |
9516 |
4932 |
4982 |
169.9 |
191.01 |
21.11 |
|
8 |
Jammu |
8648 |
8473 |
4324 |
4372 |
200 |
193.8 |
–6.2 |
|
9 |
Jammu North |
12315 |
7508 |
8502 |
3813 |
144.84 |
196.9 |
52.06 |
|
10 |
Jammu South |
8536 |
4161 |
5521 |
3015 |
154.6 |
138.01 |
–16.59 |
|
11 |
Jammu West |
9996 |
3400 |
8150 |
1703 |
122.65 |
199.64 |
76.99 |
|
12 |
Jourian |
15223 |
15450 |
8146 |
7725 |
186.87 |
200 |
13.13 |
|
13 |
Kharah Balli |
6653 |
6709 |
3467 |
3548 |
191.89 |
189.09 |
–2.8 |
|
14 |
Khour |
37846 |
40161 |
19745 |
22930 |
191.67 |
175.14 |
–16.53 |
|
15 |
Maira Mandrian |
10150 |
7268 |
5385 |
3649 |
188.48 |
199.18 |
10.7 |
|
16 |
Mandal |
22667 |
11905 |
13272 |
5985 |
170.78 |
198.91 |
28.13 |
|
17 |
Marh |
52724 |
43830 |
26931 |
22859 |
195.77 |
191.74 |
–4.03 |
|
18 |
Nagrota |
9038 |
7392 |
4657 |
3697 |
194.07 |
199.95 |
5.8 |
|
19 |
Pargwal |
15301 |
15106 |
8313 |
8252 |
184.06 |
183.05 |
–1.01 |
|
20 |
Ranbir Singh Pura |
44226 |
42491 |
23397 |
22031 |
189.02 |
192.87 |
3.85 |
|
21 |
Suchetgarh |
38557 |
44626 |
20357 |
22313 |
189.4 |
200 |
10.6 |
Source: Goshwara Jinswara statements from Assistant Commissioner (Revenue) Jammu, for crop Kharif and Rabi 2015-16 to 2022-23 of Jammu District, J&K.
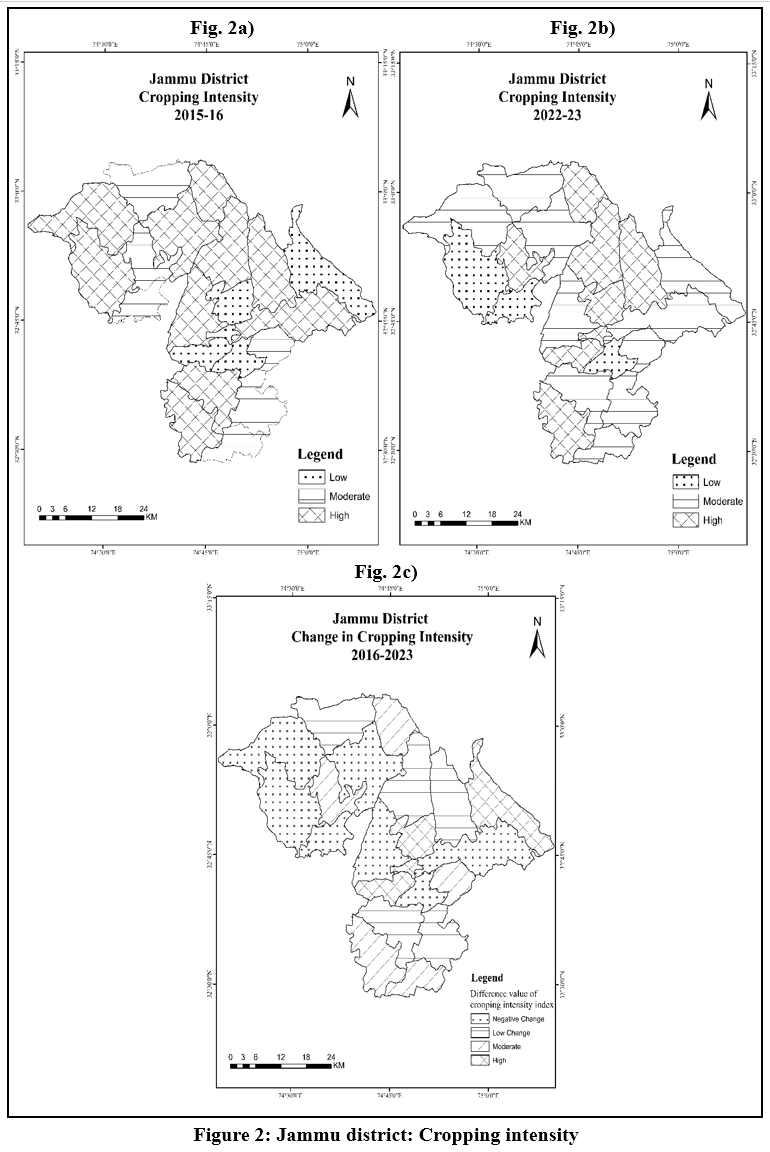 |
Figure 2: Jammu district: Cropping intensity |
Source: Fig 2a, b & c, prepared by author using Goshwara Jinswara statements from Assistant Commissioner (Revenue) Jammu, for crop Kharif and Rabi 2015-16 to 2022-23 of Jammu District, J&K. Survey of India 2025.
Spatio-temporal variations of irrigation intensity in Jammu
Irrigation intensity is a key factor in the agricultural growth of different locations and has a considerable impact on cropping patterns, crop combinations, and overall cropping intensity. Following the classification based on mean ± 0.5 SD of the irrigation intensity into three groups
- Low irrigation intensity zone (irrigation intensity <14.57 percent i.e., <Mean -0.5SD);
- Moderate irrigation intensity zone (irrigation intensity 14.57 – 39.2 percent i.e., Mean ± 0.5 SD);
- High irrigation intensity zone (irrigation intensity >39.2 percent i.e., Mean + 0.5 SD);
A separate fourth categories for null values of Irrigation intensity were identified in the study area for both the study period. The spatio-temporal variation highlights that during 2015-16 period, the high irrigation intensity has been found in entire south, south western and central part of district which consists of Arnia, Bishnah, Jammu North, Jammu West, Jammu-South, Mandal, Marh, Ranbir Singh Pura and Suchetgarh tehsil (Fig. 3). It indicates the features of the canal‑command area and low‑lying agrarian belt. The western parts of the district showed moderate irrigation intensity in 2015-16, which include tehsils Jourian, Khour and Pargwal, reflecting partial but not universal access to irrigation across their cultivated area. The entire north and north western region of district, which includes tehsils Akhnoor, Chowki Choura, Kharah Balli and Maira Mandrian, has low irrigation intensity, indicating a reliance on rainfed farming and insufficient coverage of available fields. On the other hand, based on mean ± 0.5 SD of the irrigation intensity into three groups during 2022-23 period, finding indicates that the area under high irrigation intensity remained stable in south and south western region of district, with only slight variations brought about by the change in land use of Jammu North tehsil. High irrigation intensity zone (irrigation intensity >33.73 percent i.e., Mean + 0.5 SD); has been found in western and southern region of study area which consists of tehsils Mandal, Marh, Jammu West, Bishnah, Ranbir Singh Pura, Pargwal, Arnia and Suchetgarh tehsil.
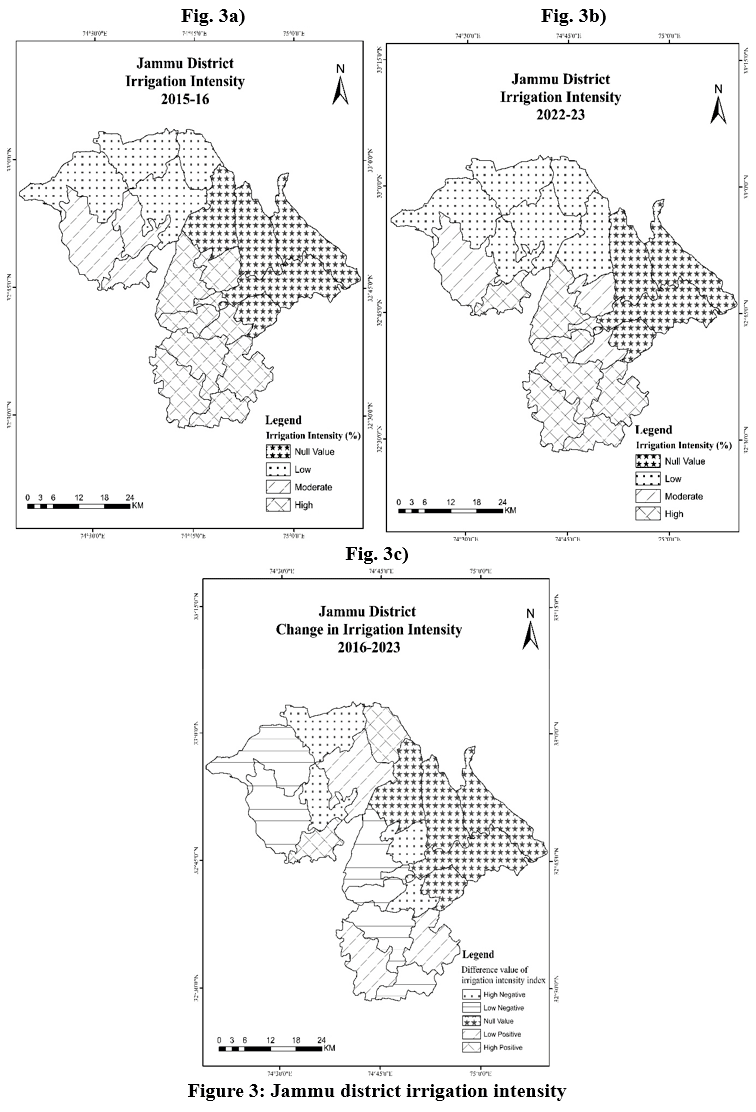 |
Figure 3: Jammu district irrigation intensity |
Source: Fig 3a, b & c, prepared by author using Goshwara Jinswara statements from Assistant Commissioner (Revenue) Jammu, for crop Kharif and Rabi 2015-16 to 2022-23 of Jammu District, J&K. Survey of India 2025.
Table 2: Jammu District Tehsil Wise Irrigation Intensity From 2015-16 to 2022-23.
|
S. No. |
Name of the Tehsils |
Gross Irrigated Area |
Gross Cropped Area |
Irrigation Intensity |
Change in Irrigation Intensity 2015-16 to 2022-23 |
|||
|
2015-16 |
2022-23 |
2015-16 |
2022-23 |
2015-16 |
2022-23 |
|||
|
1 |
Akhnoor |
1274 |
1241 |
27796 |
25343 |
4.58 |
4.90 |
6.84 |
|
2 |
Arnia |
18147 |
11670 |
31323 |
24480 |
57.94 |
47.67 |
-17.72 |
|
3 |
Bahu |
0 |
0 |
2764 |
2384 |
0.00 |
0.00 |
0.00 |
|
4 |
Bhalwal |
0 |
1785 |
38312 |
30580 |
0.00 |
5.84 |
0.00 |
|
5 |
Bishnah |
19423 |
19123 |
42928 |
40052 |
45.25 |
47.75 |
5.53 |
|
6 |
Chowki Choura |
98 |
45 |
9212 |
8135 |
1.06 |
0.55 |
-48.00 |
|
7 |
Dansal |
0 |
0 |
8384 |
9516 |
0.00 |
0.00 |
0.00 |
|
8 |
Jammu |
0 |
0 |
8648 |
8473 |
0.00 |
0.00 |
0.00 |
|
9 |
Jammu North |
6590 |
1853 |
12315 |
7508 |
53.51 |
24.68 |
-53.88 |
|
10 |
Jammu South |
3889 |
1146 |
8536 |
4161 |
45.56 |
27.54 |
-39.55 |
|
11 |
Jammu West |
6518 |
1697 |
9996 |
3400 |
65.21 |
49.91 |
-23.46 |
|
12 |
Jourian |
3364 |
1218 |
15223 |
15450 |
22.10 |
7.88 |
-64.33 |
|
13 |
Kharah Balli |
10 |
10 |
6653 |
6709 |
0.15 |
0.15 |
-0.83 |
|
14 |
Khour |
10923 |
10923 |
37846 |
40161 |
28.86 |
27.20 |
-5.76 |
|
15 |
Maira Mandrian |
38 |
91 |
10150 |
7268 |
0.37 |
1.25 |
234.43 |
|
16 |
Mandal |
13272 |
5920 |
22667 |
11905 |
58.55 |
49.73 |
-15.07 |
|
17 |
Marh |
26931 |
20971 |
52724 |
43830 |
51.08 |
47.85 |
-6.33 |
|
18 |
Nagrota |
0 |
0 |
9038 |
7392 |
0.00 |
0.00 |
0.00 |
|
19 |
Pargwal |
4623 |
5933 |
15301 |
15106 |
30.21 |
39.28 |
29.99 |
|
20 |
Ranbir Singh Pura |
23397 |
22031 |
44226 |
42491 |
52.90 |
51.85 |
-1.99 |
|
21 |
Suchetgarh |
18220 |
22313 |
38557 |
44626 |
47.25 |
50.00 |
5.81 |
Source: Goshwara Jinswara statements from Assistant Commissioner (Rev.) Jammu, for crop Kharif and Rabi 2015-16 to 2022-23 of Jammu District, J&K.
Moderate irrigation intensity zone (irrigation intensity 12.34 – 33.73 percent i.e., Mean ± 0.5 SD) has found in western and central part tehsils include; Jammu North, Jammu South and Khour. The low irrigation intensity zone (irrigation intensity <14.57 percent i.e., <Mean -0.5SD) was observed in north and north-west region of study area which consists of tehsils Chowki Choura, Jourian, Kharah Balli, Akhnoor, Maira Mandrian and Bhalwal tehsils. The finding shows that major transactions in irrigated areas occurred in central and western region of study area. The irrigation intensity of tehsil Jourian decreased from moderate to low category during 2022-23 due to land use change to non-agricultural activities. Tehsil Bhalwal is only tehsil to move from null value to low category, indicating the development of irrigation facilities, while tehsil Jammu North and Jammu South have moved from high to moderate. Tehsil Pargwal moved from moderate to high. While on the other hand it has been found that the entire southern and western belt remained unchanged. Furthermore, it has been found that during both time periods, tehsil Bahu, Dansal, Jammu and Nagrota have null irrigation intensity as in these cropping areas of district lack irrigation facilities.
Relationship between Cropping Intensity and Irrigation
Cropping intensity is influenced by many factors such as use of fertilizers, irrigation, rainfall and availability of labour.5 However, this study is concerned with examining the relationship and how irrigation impact cropping intensity in Jammu district. Two residual maps were used to determine the link between cropping intensity and irrigation intensity in the Jammu district between 2015–2016 and 2022–2023 (Fig. 4). The residual value of 0.00 indicates an ideal correlation between cropping intensity and irrigation intensity. A positive corelation in a tehsil suggests a positive link between cropping intensity and irrigation intensity, implying the impact of factors such as favourable agro-ecological conditions and the use of contemporary technology inputs such as chemical fertilizers and high-yield seeds. Tehsils with a negative residual value on the other hand indicated that cropping intensity and irrigated intensity are negatively correlated. This result could be linked to unfavourable agro-ecological conditions and lower adoption rates of other technology inputs. In 2015–2016, the line with a residual value of 0.00 traversed through Kharah Balli, Khour, Pargwal, Jourian, Akhnoor, Mira Mandrian, Bhalwal, Mandal, Nagrota, Jammu, Arnia, and Bishna tehsil of the study area (Fig. 4a). High positive line passes through Marh, Ranbir Singh Pura and Suchetgarh tehsil. While, the negative line crossed through Dansal, Chowki Choura, Bahu, Jammu North, Jammu West, and Jammu South. (Fig. 4a). Figure 4b unveiled that in 2022–2023, the high positive line passes through Jourian, Mira Mandrian, Bhalwal, Jammu North, Jammu West, Mandal, Nagrota, and Suchetgarh tehsil, the line with a residual value of 0.00 traversed through Ranbir Singh Pura, Chowki Choura, Jammu, Dansal, Arnia, and Marh tehsil of the study area. While, the low negative line crossed through Kharah Balli, Bishnah, Pargwal and Bahu. However, Khour, and Jammu South tehsil show high negative line. This shows improvement in relationship between Dansal, Jourian, Mira Mandrian, Bhalwal, Mandal and Jammu North tehsil and decline in Khour (Fig. 4b).
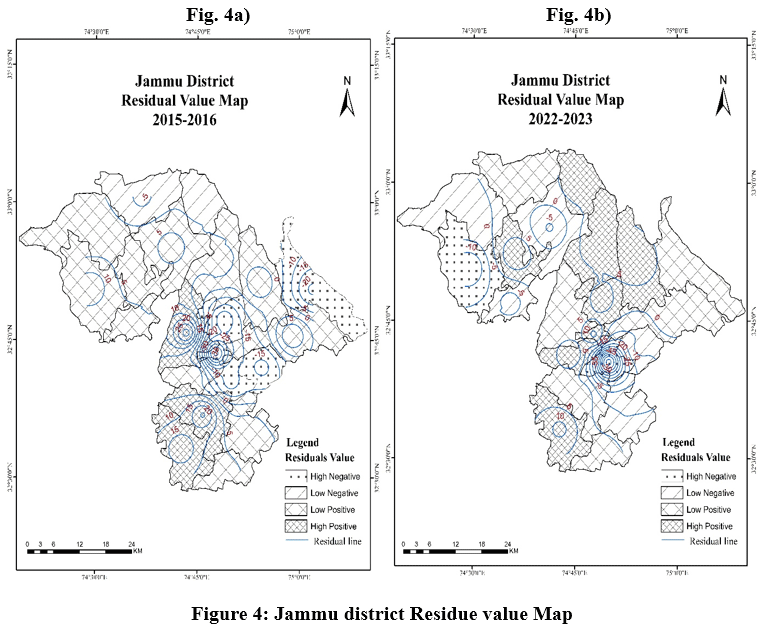 |
Figure 4: Jammu district Residue value Map |
Source: Fig 4a & b, prepared by author using Goshwara Jinswara statements from Assistant Commissioner (Revenue) Jammu, for crop Kharif and Rabi 2015-16 to 2022-23 of Jammu District, J&K. Survey of India 2025.
Recommendations
It is a necessary to ensure equitable distribution of irrigation facilities in tehsils of low and moderate irrigation intensity, i.e., Akhnoor, Bhalwal, Dansal and Nagrota. Special attention is required for the widespread adoption of efficient irrigation technologies, particularly drip irrigation, in the tehsils of Bahu, Dansal, Jammu and Nagrota, which lack irrigation infrastructure. These areas require targeted interventions to address their specific challenges and improve agricultural productivity. To meet present demands, it is critical to adopt sustainable farming practices, that prioritizing efficient irrigation methods.
Conclusion
Based upon the above discussion the study found a slight improvement 5.85 percent in cropping intensity during 2015-16 to 2022-23 time period, despite decline in net sown area. The result reveals inter-tehsil variation and found that, the cropping intensity varied very positively (>21.10) in Dansal, Jammu North, Jammu West and Mandal, a moderate positive in the tehsils of Maira Mandrian, Suchetgarh, Bahu, Arnia and Jourian to a low positive in the tehsils in Bhalwal, Bishna, Chowki Choura, Nagrota and Ranbir Singh Pura. Negative variation in cropping intensity found in western and central part including Kharah Balli, Khour, Marh, Akhnoor, Pargwal, Jammu South and Jammu were characterized by negative variation. This study also examined the spatio-temporal variation of irrigation intensity, and the findings shows that tehsil Bhalwal is only tehsil to move from null value to low category, indicating the development of irrigation facilities, while tehsil Jammu North and Jammu South decreased from high to moderate. Tehsil Pargwal moved from moderate to high. While on the other hand it has been found that the entire southern and western belt remained unchanged, tehsil Bahu, Dansal, Jammu and Nagrota have null irrigation intensity as in these cropping areas of district lack irrigation facilities. The findings highlight an optimum relationship between cropping intensity and irrigation intensity have been found in tehsil Kharah Balli, Khour, Pargwal, Jourian, Akhnoor, Mira Mandrian, Bhalwal, Mandal, Nagrota, Jammu, Arnia, and Bishna. Tehsils showing positive relationship includes Marh, Ranbir Singh Pura and Suchetgarh, indicating the impact of factors such as favourable agro-ecological conditions and the adoption of modern technological. Kharah Balli, Khour, Marh, Akhnoor, Pargwal, Jammu South and Jammu tehsils with a negative relationship indicate adverse agro-ecological conditions and other technological inputs.
Table 3: Jammu District Regression Statistics
|
Regression Statistics 2015-16 |
Regression Statistics 2022-23 |
||
|
Multiple R |
0.544200733 |
Multiple R |
0.060654946 |
|
R Square |
0.296154437 |
R Square |
0.003679022 |
|
Correlation coefficient |
-0.412903988 |
Correlation coefficient |
-0.03796568 |
|
Significance F |
0.010759439 |
Significance F |
0.0493957 |
|
Adjusted R Square |
0.259109934 |
Adjusted R Square |
-0.048758924 |
|
Standard Error |
16.4837097 |
Standard Error |
14.05099776 |
|
Observations |
21 |
Observations |
21 |
Source: Calculated by the authors.
Acknowledgement
The first author would like to thank Department of Geography, University of Jammu for granting the Ph. D. research work. The authors are also profoundly grateful to the Assistant Commissioner (Rev), for providing the Goshwara Jinswara statements for crop Kharif and Rabi 2015-16 to 2022-23 of Jammu District.
Funding Sources
The author(s) received no financial support for the research, authorship, and/or publication of this article.
Conflict of Interest
The authors do not have any conflict of interest.
Data Availability Statement
Access is restricted and available on request from the issuing office (Assistant Commissioner (Rev) Jammu District).
Ethical Statement
This research did not involve human participants, animal subjects, or any material that requires ethical approval.
Informed Consent Statement
This study did not involve human participants, and therefore, informed consent was not required.
Clinical Trial Registration
This research does not involve any clinical trials.
Permission to reproduce material from other sources
Not Applicable
Author Contributions
- Yog Raj Singh: conceptualized the study, collected and analyzed the data, performed GIS analysis, and prepared the original manuscript draft.
- Inder Jeet Singh: supervised the research work, contributed to methodology development, reviewed and edited the manuscript.
References
- Das, S., Sharma, K. K., Majumder, S., Das, D., & Chowdhury, I. R. Spatio-temporal variation and relationship between agricultural efficiency and irrigation intensity in a semi-arid region of India. Regional Sustainability. 2024; 5(2), https://doi.org/10.1016/j.regsus.2024.100144
CrossRef - Dayal, E. A measurement of cropping intensity. Professional Geographer. 1978; 30(3), 289–296.
CrossRef - Deshmukh, M. S., & Tanaji, S. V. Cropping intensity index and irrigation intensity in India. North Asian International Research Journal of Social Science and Humanities. 2017; 3(2), 3–10.
- García, R. V., Gaspart, F., Kastner, T., & Meyfroidt, P. Agricultural intensification and land use change: Assessing country-level induced intensification, land sparing and rebound effect. Environmental Research Letters. 2020; 15(8), https://doi.org/10.1088/1748-9326/ab8b14
CrossRef - Mondal, T. K. & Sarkar, S. Analysis of cropping intensity and irrigation intensity in North Twenty Four Parganas district, West Bengal, India, Miscellanea Geographica Regional Studies on Development. 2021; 25(4). 10.2478/mgrsd-2020-0063
CrossRef - Jain, M., Mondal, P., DeFries, R. S., Small, C. & Galford, G. L. Mapping cropping intensity of smallholder farms: A comparison of methods using multiple sensors, Remote Sensing of Environment. 2013; 134, 210–223. http://dx.doi.org/10.1016/j.rse.2013.02.029
CrossRef - Yu, Q., Xiang, M., Sun, Z., & Wu, W. The complexity of measuring cropland use intensity: An empirical study. Agricultural Systems. 2021; 192, 103180. https://doi.org/10.1016/j.agsy.2021.103180
CrossRef - Pattanayak, U., & Mallick, M. A study on irrigation and agricultural productivity in Odisha. Economic Affairs. 2018; 63(2), 317–323. https://doi.org/10.30954/0424-2513.2.2018.4
CrossRef - Wu, W., Yu, Q., You, L., Chen, K., Tang, H. & Liu, J. Cropping intensity gaps: Increasing food production without cropland expansion. Land Use Policy. 2017; https://doi.org/10.1016/landusepol.2018.02.032
CrossRef - Fishman, R., Giné, X., & Jacoby, H. G. Efficient irrigation and water conservation: Evidence from South India. Journal of Development Economics. 2023; 162, https://doi.org/10.1016/j.jdeveco.2023.103051
CrossRef - Radulović, M., Marković, M., Brdar, S., Athanasiadis, I., Lugonja, P., & Crnojević, V. (2024). Unlocking agricultural potential: The role of irrigation practices and cropping intensity in Vojvodina, Serbia. Proceedings of the 11th International Conference on ICT in Agriculture, Food & Environment – HEICTA. 2024; https://doi.org/10.13140/RG.2.2.33271.94881
- Kaini, S., Gardner, T. & Sharma, A. K. Assessment of socio-economic factors impacting on the cropping intensity of an irrigation scheme in developing countries, Irrigation and Drainage. 2020; 69(3), 363–375. https://doi.org/10.1002/ird.2427
CrossRef - Gosh, A., Nanda, M. K. & Sarkar, D. Assessing the spatial variation of cropping intensity using multi‑temporal Sentinel‑2 data by rule‑based classification. Environment Development and Sustainability. 2021; 24, 10829–10851. https://doi.org/10.1007/s10668-021-01885-0
CrossRef - Mrabet, R. Sustainable agriculture for food and nutritional security. In Sustainable Agriculture and the Environment. Elsevier. 2023; 25–90. https://doi.org/10.1016/B978-0-323-90500-8.00013-0
CrossRef - Magidi, J., van Koppen, B., Nhamo, L., Mpandeli, S., Slotow, R., Mabhaudhi, T. Informing equitable water and food policies through accurate spatial information on irrigated areas in smallholder farming systems. Water. 2021; 13 (24). https://doi.org/10.3390/w13243627
CrossRef - Jin, S., Yu, W., Jansen, H. G. P., & Muraoka, R. The impact of irrigation on agricultural productivity: Evidence from India. Michigan State University; World Bank. 2013; https://doi.org/10.22004/ag.econ.126868
- Narayanamoorthy, A., Alli, P., & Suresh, R. Is the role of irrigation in agricultural output declining in India?: A district-wise study at six time points. Indian Journal of Agricultural Economics, 2013; 70(3), https://doi.org/10.22004/ag.econ.230068
- Velpuri, N. M., Thenkabail, P., Gumma, M. K., Yuanjie, L., et al. Influence of resolution in irrigated area mapping and area estimation. Photogrammetric Engineering & Remote Sensing, 2009; 75(12), 1383–1392. https://doi.org/10.14358/PERS.75.12.1383
CrossRef - Grafton, R. Q., Williams, J., Perry, C. J., Molle, F., Ringler, C., Steduto, P., Udall, B., Wheeler, S. A., Wang, Y., Garrick, D., & Allen, R. G. The paradox of irrigation efficiency. Science, 2018; 361(6404), 748–750. https://doi.org/10.1126/science.aat9314
CrossRef - Gupta, S., et al. Measuring and monitoring urban sprawl in Kathua city of Jammu and Kashmir using geospatial techniques. The Deccan geographer, 2024; 62(8), 192-203.
- Singh, Y. R., et al. Spatial-Temporal Variation of Agricultural Efficiency in Jammu Division of Jammu and Kashmir. The Deccan Geographer, 2025; 262-274.
- Koul, P.A. Geography of Jammu and Kashmir state, Light & Life Publication Jammu. 2015; 12-13.
- Manhal, V.S., & Jasrotia, R. Systematic Geography of Jammu and Kashmir, Commonwealth Publishers PVT. LTD. New Delhi. 2013; 15-25.
- Kaul, A.K. Studies in Geography of Jammu and Kashmir, Rawat Publication Jaipur. 2014; 28-38.
- Rayaz, K. Resource Geography of Jammu and Kashmir, Saksham Books International Jammu. 2001; 42-43.
- Directorate of Economics and Statistics, Jammu & Kashmir. Digest of statistics 2020–21. Government of Jammu and Kashmir, Planning, Development and Monitoring Department. 2021; https://ecostatjk.nic.in
- Directorate of Census Operations Jammu & Kashmir. District Census Handbook: Jammu. Census of India 2011. 2011; Series 02, Part XII-B. https://censusindia.gov.in/nada/index.php/catalog/531
- Office of the Registrar General & Census Commissioner, India. of India 2011. Ministry of Home Affairs, Government of India. 2011; https://censusindia.gov.in
- Goshwara Jinswara statements from Assistant Commissioner (Rev.) Jammu, for crop Kharif and Rabi 2016-17 of Jammu District, J&K.
- Goshwara Jinswara statements from Assistant Commissioner (Rev.) Jammu, for crop Kharif and Rabi 2022-23 of Jammu District, J&K.
- Survey of India. Survey of India. Department of Science & Technology, Government of India. 2025; https://surveyofindia.gov.in