

Introduction
As an agrarian economy, expanding the Gross Domestic Product (GDP) is largely underpinned by the agriculture sector in Ghana. In 2019, the agriculture sector contributed more than 17% to the country’s GDP. In terms of exports, agriculture products (cocoa and non-traditional exports) accounted for about 29% of the export earnings, worth about 4 billion US dollars 20. The sector is also the main source for household income, food security, poverty reduction and a driver of livelihoods of rural population as it employs about 40% of the Ghanaian labour force 19. That notwithstanding, agriculture is still at rudimentary stage dominated by smallholder farmers whose production constitute about 80% of the output of the country 37.
Now, one of the ambitious United Nations (UN) Sustainable Development Goals (SDGs) is to end global poverty and zero hunger by 2030. However, several challenges including climate change is thwarting effort in the agriculture sector, resulting in persistent low yield of crops each growing season. Extreme climate event for instance, is projected to cause about 20 -50% declines in crops’ yield by 2050 in sub–Saharan Africa (SSA) 14, 30. Ghana is one of the most vulnerable economies to current and future climate variability where crops in annual growing seasons are prone to drought and flood disasters, often resulting in total crop failures, the main cause of poverty particularly, in the five regions in Northern Ghana. Yet the United Nations (UN) 33 estimates that agricultural productivity and incomes will need to double by 2030 to meet increasing demand for food for human and animals. Hence, depending on climate-based agriculture is unsustainable in the providing food for human and livestock as well as strengthen the climate change adaptation ability of smallholder farmers.
Since the 1960s, the Ghanaian government has placed emphasis on the construction of reservoirs-based irrigation schemes as a remedy to de-link food production from rainfed agriculture and to agriculture boost productivity 38. Unfortunately, the country’s irrigation infrastructure has not expanded as expected due to a number of challenges 37. Available data indicates that Ghana has approximately 1.9 million hectares irrigable land potential, but only 1.6 percent or 31,000 hectares is under fully controlled irrigation, the lowest in Africa 19. That notwithstanding, a number of reservoir-based irrigation schemes have been constructed in the Northern regions to augment the uni-modal rainfall agriculture practices 6, 36. A reservoir-based irrigation scheme here refers to an agricultural project that involves multiple holdings and shared distribution systems for access to irrigation water for crop production in the dry season and other competing uses 2, 35.
In the Upper East Region, two irrigation schemes, namely the Vea and Tono irrigation schemes were developed as part of the government’s developmental drive to expand all-year agriculture production so as to improve livelihood of the people 16. The Tono irrigation scheme is the single largest irrigation dam in Ghana, Dinye and Ayitio 15 combined with the Vea irrigation schemes collectively contributes over 3000ha land for irrigation to enhance food production in the country. Strategically, the Tono and Vea irrigation schemes were meant to eliminate the long spell of dry season, which limits agriculture activities in the region. The target crops were rice and vegetable in view of their relative importance to the country’s economy. According to Giordano and de Fraiture 21, there is a positive correlation between irrigation and agricultural productivity, food security and poverty reduction.
Currently, rice and pepper are two dominant crops being cultivated in the two irrigation sites. Unfortunately, the yields for these crops have been low compared to global averages as indicated in table 1:
Table 1: Recent Global Production of Rice and Pepper and that of Ghana.
| Crop | Year | World (Metric tons/ha) | Ghana (Metric tons/ha) |
| Rice | 2019 | 4.662 | 2.880 |
| 2018 | 4.609 | 2.824 | |
| 2017 | 4.557 | 2.820 | |
| 2016 | 4.569 | 2.696 | |
| 2015 | 4.512 | 2.638 | |
| Pepper | 2019 | 19.100 | 9.694 |
| 2018 | 18.747 | 9.370 | |
| 2017 | 17.897 | 8.500 | |
| 2016 | 17.664 | 8.500 | |
| 2015 | 16.555 | 8.500 |
FAOSTAT (2021)
Ghana imports large volume of rice and pepper annually from other countries to meet demand which put pressure on the country’s foreign reserves. Strategies to increase the production of these crops, therefore were expected to stabilize prices, creates employment and improves income for the farmers. As part of the Tono and Vea irrigation schemes, beneficiary farmers were given input credit including the provision of fertilizer, seed, pesticides, tractor services as well as extension services on credit by government through ICOUR to be paid back after harvest 15. Several decades after its establishment, all other support to the farmers have ceased except supplying them with the irrigation water and extension services but the farmers continue to produce both rice and vegetable. The infrastructure has suffered dilapidation for several years due to lack of maintenance 2, 11, 26, 36.
Although most irrigation schemes in the SSA and the Upper East Region have already been investigated, most evaluations mainly focus on the impact of individual irrigation schemes. For example, Abdulai et al.,1 investigated on the technical efficiency of farmers in the Tono irrigation scheme; Clottey et al., 13 studied on constraints and strategies to improve competitiveness in irrigation systems. The efficiency of irrigation schemes in northern Ghana in terms of water delivery, physical structure, financial and crop production was also conducted by Adongo et al., 5 while Sekyi- Annan et al., 31 evaluated the reservoir- based irrigation schemes in Bongo and Vea. No study has been conducted to evaluate the field level performance of the Tono and Vea irrigation schemes especially in terms of the yields and profitability of the crops cultivated in the project areas. The study therefore evaluates the productivity and profitability of rice and pepper cultivation on the fields of the Tono and Vea irrigation sites in Ghana. Productivity is commonly defined as ratio of output to the ratio of input 24. However, this study defines productivity as the output per unit input (land). Gross margin is used to indicate the profitability of the farms and are thus used interchangeably. The study would therefore add to existing literature on how the two schemes are benefitting farmers in the region. This will also enable distil useful policy recommendations on how to improve farm profits and achieve sustainability of the irrigation schemes. Additionally, it would be useful to researchers, academics and development partners interested in identifying opportunities to enhance irrigation development in Ghana.
Background of Irrigation Development and Management in Ghana
Irrigation development in Ghana began as a Land Planning and Soil Conservation Unit under the Department of Agriculture in the early 1950s, but was expanded to the department of irrigation development in 1965. Subsequently, the department was transformed to Ghana Irrigation Development Authority (GIDA) under the Supreme Military Council Decree (SMCD) No. 85 Act 1977 22, 23.
Guided by Legislative Instruments, LI 1350 of 1977 and LI 1350 of 1987, GIDA was added the responsibility to regulate and manage public irrigation schemes in Ghana. Furtherance to the LIs 1995 of 2011 and LI 2230 of 2016, GIDA was further mandated to regulate private investment in public irrigation as well as promote the establishment and regulation of Water Users Associations (WUAs) nationwide 22, 23, 28. These arrangements paved way for both the government and the private sector to expand irrigation infrastructure across the country to support all-year farming in a sustainable manner.
Materials and Methods
Study Area
The study covered the catchment areas of the Tono and Vea irrigation projects in the Kasena Nankana East and Bolgatanga Municipals and Bongo District in the Upper East Region of Ghana as shown in figure 1. Both projects were proposed by the Nkrumah government under the agricultural development initiative to enhance the development of the north with a large share of the national resources than ever had been the case during the colonial administration. The construction of the Tono irrigation project began in 1975 with loan from the Canadian and British governments but was not completed until 1985.
The project was mainly an embankment across the Tono River to form a 2,490ha reservoir with the capacity to provide 37million cubic meters of water for irrigation purpose. The maximum surface area of the dam is 1,860ha. It has a maximum storage capacity of 93 × 106m3; live storage of 83 × 106m3 with a dead storage of 10 × 106m3. The gross project area is 3860ha but 2490ha was initially developed for irrigation purposes. The catchment area is 650km2 with main canal length of 42km. The total length of the roads is 120km. It has an altitude of 160meters above sea level 22. The project is demarcated into 24 zones and serves 8 villages namely Bonia, Wuru, Yoogbannia, Yigbwannia, Korania, Gaani, chuchuliga and Biu.
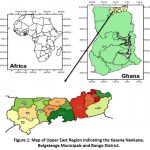 |
Figure 1: Map of Upper East Region indicating the Kasena Nankana, Bolgatanga Municipals and Bongo District. |
On the other hand, the Vea irrigation project, though, is one of the oldest, was constructed by the government of Ghana in 1965; but its construction was only completed 1980. The gross area covers 1,197ha, 850ha developed area but 500ha is currently irrigable 28. The maximum surface area of the dam is 405ha. It has a maximum storage capacity of 17 × 106m3; live storage of 16 × 106m3 with a dead storage of 1 × 10⁶m3. The project is 180 meters above sea level. The catchment area is 136km2. The length of the main canal is 21km with 18km road. Like the Tono project, the Vea irrigation project serves 8 villages as illustrated in a layout of the project showing the villages in figure 3 below: These villages include Vea, Gowrie and Bongo-Nyariga in the Bongo District as well as Bolga-Nyariga, Zaare, Dindubbisi, Yikene, and Sumbrungu in the Bolgatanga Municipality.
Until 1981, both projects were managed by Tate and Lyle Engineering Services Limited, a British multilateral company on behalf of the Irrigation Development Agency. The expatriate management left after the military take-over of the government of Ghana in 1981 and the projects were put under the control of Peoples Defence Committee (PDC). The PDC later transferred the management power to Irrigation Company of Upper Region (ICOUR), a newly established parasternal in 1983 15.
Sampling and Sample Size
The sampling frame for the study comprises 1,600 and 2,800 crop farmers from 16 villages who cultivate rice and pepper in the Vea and Tono projects areas, respectively. The study adopts a multistage sampling technique for the data gathering. In the first stage, purposive sampling was applied to select eight (8) villages. That is, four (4) villages each from the Tono and Vea project areas for the study. Secondly, simple random sampling was employed to select 120 farmers by applying Yamane 39 formular given as: n=N/1+N(e)2, where n is the sample size, N is the sample frame, e is the margin error at 95% confidence level and 15% precision to select the sample. The sample comprises eighty (80) farmers from the Tono and forty (40) farmers from the Vea project areas. More farmers were selected from Tono project in view of the relatively large number of farmers and the size of the beneficiary farmers compared to the Vea project.
Primary data was collected via a structured questionnaire and a one-on-one quantitative interview to elicit the relevant information from the individual crop farmers and staff of ICOUR. Although in both project areas farmers cultivate various crops including rice, pepper, tomato, onions, garden eggs, and leafy vegetables, the study focused on only rice and pepper farmers because they are currently the most dominant crops produced in the areas. Data on socioeconomic and demographic information, cost of inputs and prices of produce among other relevant information were collected during the field survey. Precisely, demographic information covered the age of farmers, sex, educational level, experiences and land acquisition. Out of the 120 questionnaires, 113 farmers comprising Gani (n = 19), Bonia (n = 20), Korania (n = 19), Wuro (n = 15) from Tono and, Gowrie (n =15), Vea (n = 10), Nyariga (n = 10) and Zaare (n = 5) from the Vea project areas responded appropriately to the interview. Seven (7) questionnaires were removed due to incomplete data. The farmers were selected based on the number of beneficiary farmers in each farming community.
Analytical Framework and Empirical Specification
The study applied gross margin budgetary technique and pair-wise comparison of means to generate means via the use of STATA 13.0 software. Several studies 4, 9, 10, have used gross margin analysis to estimate the cost and return per hectare at the farm level. Gross margin (GM) is defined as;
![]()
TR, defined as Total Revenue and TVC, Total Variable cost are given as ;
TR = Quantity of output (Qi) × Price (Pi)
TVC = Quantity of inputs (Xj) × price (Pj)
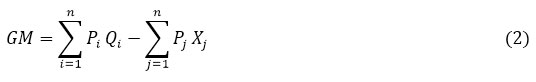
Pi = Average price of output i (Ghȼ per kg)
Qi = Average quantity of output i (kg per ha)
Pj = Average price of input i (Ghȼ per kg)
Xj = Average quantity of output i (kg per ha)
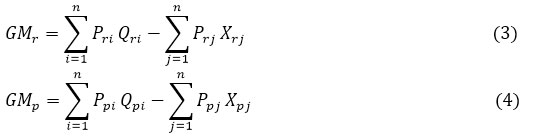
Based on equation (2), the study employed the following formulae to estimate gross margins for rice and pepper at the farm level in the study area:
Where:
GMr and GMp = Gross Margin of rice and pepper respectively.
Pri and Qri = average price and average quantity of rice.
Ppi and Qpi = average price and average quantity of pepper.
Prj Xrj = average cost for rice farm land preparation, planting, weeding, fertilizing, agrochemical spraying, harvesting, water levy.
Ppj Xpj = average cost for pepper farm land preparation, planting, weeding, fertilizing, agrochemical spraying, harvesting, water levy.
TVC = Total Variable Cost is the summation of all variable costs including costs of seed, land preparation, fertilizer, agrochemical spraying and their associated labour cost and water levy. The cost of labour (both family labour and hired labour) was imputed by multiplying total man-days of labour by the prevailing wage rate in the project areas. No cost was associated with the acquisition of land most farmers mainly inherited land from their families at the project sites. Total Fixed Cost (TFC) which is shared cost at the farm level is usually a depreciation of all fixed assets (farm tools, and equipment such as hoes, cutlasses, sprayers, etc) was not included since it was a gross margin analysis.
Estimation of Productivity
The study defines productivity as output (food harvested) per unit input (land) as given by Martey et al 24 :
![]()
Analysis of Cost Per Ghana Cedi Spent
The study also applied Cost per Cedi Analysis as used by Ayodele et al 19, which measures the rate of return on investment give as:
![]()
Comparison of Farm Performance between the Tono and Vea two Irrigation Sites
The paper estimates the means for all the socio-economic variables, the total variable cost and gross margin as well as calculates the rate of return on investment per hectare. The paired sample t-test was applied to examine the differences in the gross margins (profits) per hectare for rice and pepper farms in the two irrigation sites. For equity to exist between the two fields in terms of performance, the paired sample t-test should not be statistically significant.
Results and Discussion
Socio-Economic and Demographic Characteristics of Respondents
Table 2 below depicts the means of the socio-economic variables of the crop farmers at the Tono and Vea irrigation sites. The mean age of the farmers at both Tono and Vea areas was 37.52, an indication that the youth is interested in farming as an occupation. The age of famers at the Tono project is much younger, averaging 37 years than farmers at Vea project who were 39 years old though the difference was not statistically significant. This confirms the findings of Abdulai 1 that youthful adult population are engaged in farming at the Tono irrigation project. This needs to be encouraged considering the aging farmer population in Ghana. Extension officers visited the farmers averagely twice in the season, which was quite low considering the important role extension advisory service plays in reducing farm inefficiency and improve technology adoption in modern agriculture 7, 12. The farmers had averagely 7 years’ experience but those at Tono were much experienced (9 years) than their counterparts at Vea project who had only 2 years’ experience, an indication that experience of farmers at Tono project might have played a role improving farm productivity resulting in higher income than those from Vea project site.
Household labour plays important role in smallholder family farms as it enhances the availability of labour force for farm activities 7. The study showed that the average household size of the farmers was 4 at Tono and 6 at Vea project site and the difference was statistically significant at 1% level. The average landholding of farmers is 0.70ha but the farms are much larger at Tono (0.79ha) than at Vea (0.51ha) but the difference was not statistically significant. This confirms the findings of Abdulai and Namara et al., 1, 28 who all concluded that the average farm size of families at Tono project was less than 0.8ha. The study reveals that about 0.59ha was sown with 35.79kg rice seed at the Tono project site whilst 0.38ha was sown with 21.25kg of rice seed at the Vea projects respectively but the difference was however, not statistically significant. Additionally, the study reveals an average of 0.35ha and 0.32ha were planted with 0.136kg and 0.195kg pepper seed at the Tono and Vea irrigation schemes respectively. This is higher than the national recommended seed rate of 0.25kg ha-1 25 which brings the question whether the pepper seeds were viable. This because recycling own farm seeds for planting is a common practice at both projects’ areas, which account for the low yields of crops in Africa and Ghana in particular 25.
Table 2: Some Socio-Economic and Demographic Characteristics of Respondents.
| Irrigation Projects | |||||
| Variable | Total (n=113) | Tono (n=77) | Vea (n=36) | Mean diff | T-value |
| Age (years) | 37.52 (10.63) | 36.71(9.40) | 39.25 (11.63) | -2.54 | -1.24 |
| Extension Visits | 1.72 (0.92) | 1.78 (0.89) | 1.58 (1.08) | 0.20 | 1.01 |
| Experience (years) | 6.89 (6.62) | 9.05 (7.00) | 2.28 (1.19) | 6.77*** | 5.75 |
| Household labour | 4.49 (2.63) | 3.90 (2.09) | 5.75 (3.21) | -1.85*** | -3.65 |
| Total landholding | 0.70 (0.59) | 0.79 (0.59) | 0.51 (0.56) | 0.28 | 2.42 |
| Area under rice cultivation (ha) | 0.53 (0.50) | 0.591 (0.538) | 0.38 (0.377) | 0.20** | 1.94 |
| Quantity of Rice Seed (Kg) | 31.52(24.58) | 35.79 (36.55) | 21.25 (14.94) | 14.54*** | 2.90 |
| Area under pepper cultivation(ha) | 0.34 (0.23) | 0.35 (0.24) | 0.32 (0.18) | 0.03 | 0.24 |
| Quantity of Pepper Seed (Kg) | 0.140 (0.122) | 0.136 (0.126) | 0.195 (0.067) | -0.059 | -1.03 |
Values in parentheses indicate Standard deviations
Source: Author’s computation, 2021
***,**,are significant at 1%, 5% levels respectively.
Inputs and Cost of Farm Production
The study shows that the major inputs in the cultivation of rice and pepper include seed, labour, fertilizer (N.P.K and Urea) and agro chemicals (pesticides, fungicides, and herbicides). This confirms the finding of Robinson and Kolavalli 29 who concluded that seed, fertilizer, pesticides and fungicides are the main drivers of the high cost of irrigation farming in Ghana. Farmers spend about 2 to 3 hours daily on their farm activities including land preparation, raising seed nursery, transplanting and harvesting 29. Male farmers are often involved in land preparation whilst female farmers engage in transplanting, hand picking of weeds, and harvesting among others. Few farmers, especially the commercial ones at the Tono area could afford the use of rented tractor mounted with rotavator (rotary tiller with rotating blades) and combine harvesters for land preparation and harvesting services, respectively.
Table 3 depicts the mean cost per hectare in rice cultivation at the Tono and Vea project sites. The average cost for rice seed was Ghȼ 129.37 ha-1 but the cost was higher at the Vea project area (Ghȼ 156.28 ha-1) as compared to Tono project site (Ghȼ118.18 ha-1) at 10% level of significant difference. The availability of improved seeds has been a major challenge hampering the achievement of good yield of rice in Ghana. Addison et al., 3 in their study in Ashanti region stated that lack of certified seed from shops compelled farmers to rely on either MoFA or own recycled seeds which is largely responsible for the low productivity of rice in Ghana. The average cost of land preparation was Ghȼ339.17 ha-1. However, the cost was higher (Ghȼ 386.84 ha-1) at the Vea compared to the Tono project sites (Ghȼ319.36 ha–1) at 10% level of statistically significant difference. The high cost at Vea was partly due to the inability of farmers to employ machinery due to small farm size, which has compelling them to rely on manual farm activities using the hoe and cutlass as their main tools for land preparation, though, the use of the rotavator performs better at reduced cost. The use of the rotavator was common at the Tono irrigation site whilst the use of hoe and cutlass continue to dominate in land preparation at the Vea project site, perhaps due to the relatively small land holdings, which makes access to mechanisation services quite difficult 27.
Women are usually employed for transplanting seedling of rice and pepper in both project sites. The average cost of labour for transplanting rice was Ghȼ 469.13ha-1at both project sites, however, the cost was higher at Tono (Ghȼ 513.96 ha-1) as compared to Vea (Ghȼ 361.25 ha-1) at 10% level of statistically significant difference. Few farmers, particularly those at the Tono project area adopt row planting. Although transplanting on rows is time consuming, it has positive influence on yield of rice 18, 34. Spraying with selective herbicides as a way to control weeds is now commonly practiced by farmers at both irrigation sites. This activity is then followed by hand picking the remaining “stubborn” weeds, a practice that has been useful in minimising the cost of rice production at the Tono irrigation site. The average cost incurred in weeding rice field was Ghȼ 373.61 ha-1. However, the average cost of weeding was significantly lower at the Tono project (Ghȼ 336.22 ha-1) than farmers at the Vea project site (Ghȼ 463.59 ha-1), perhaps due to reliance on manual weeding of their fields.
Table 3: Cost of Rice Cultivation (Ghȼ ha-1) $ 1= Ghȼ 5.75.
| Irrigation Projects’ Cost of Rice Production | |||||
| Cost Item | Total (n=109) | Tono (n=77) | Vea (n=32) | Mean diff | T value |
| Seed cost | 129.37 (74.880 | 118.18 (69.23) | 156.28 (82.02) | -38.10* | -2.48 |
| Land preparation | 339.17 (127.77) | 319.36 (97.79) | 386.84 (173.52) | -67.48* | -2.58 |
| Transplanting (labour) | 469.13 (293.24) | 513.96 (301.02) | 361.25 (245.83) | 152.71* | 2.54 |
| Weeding (labour) | 373.61(283.45) | 336.22 (294.16) | 463.59 (236.50) | -127.37 | -2.17 |
| Fertilizer | 499.87 (224.50) | 436.54 (160.96) | 652.87 (279.56) | -215.70*** | -5.06 |
| Spraying (chem. and labour) | 201.38 (225.98) | 207.61 (230.67) | 186.37 (217.11) | 21.23 | 0.45 |
| Water levy | 150 | 150 | 150 | 0 | . |
| Harvesting (labour) | 695.88 (394.53) | 857.27 (332.05) | 307.53 (227.15) | 549.74*** | 8.56 |
| TVC | 2858.14(786.42) | 2938.87(741.32) | 2663.88(866.28) | 274.99* | 1.68 |
Values in parentheses indicate Standard deviations
Source: Author’s computation, 2021
***, * are significant at 1% and 10% levels respectively.
The cost of harvesting rice was averagely Ghȼ 695.88 ha-1 at both project sites but the cost at Vea (Ghȼ 307.53 ha-1) was quite lower as compared to Tono project site (Ghȼ 857.27 ha-1). This was not expected considering the fact that farmers at the Tono project use combine harvesters which should have minimised the average cost of harvesting compared to farmers at the Vea site who rely on the use of sickles and threshing with sticks on platforms. Perhaps, the farmers might have under estimated their cost for harvesting since they hardly keep records on their operations. The payment of water levy is part of the operational cost of farming at both project sites. The farmers negotiate and agree on the water levy per annum. For the 2020/2021 cropping year, Ghȼ 150.00 per hectare was the agreed water levy. Hence, the overall average total cost in the production of rice was Ghȼ 2858.14 ha-1. The farmers at Tono spend averagely higher (Ghȼ 2938.87 ha-1) compared to those at the Vea project site (Ghȼ 2663.88 ha-1) at 10% significant difference.
The Cost of Pepper Production
Table 4 below reveals the mean cost incurred in the production of pepper at Tono and Vea project sites in Ghana. The average cost for pepper seed was 399.90 ha-1 at both sites but the cost was higher for farmers at Tono (Ghȼ411.00 ha-1) compared to those at Vea (Ghȼ 280.00 ha-1) but the difference was not statistically significant even at 10% level. The farmers at Vea spend averagely higher (Ghȼ561.60 ha-1) on land preparation than the farmers at Tono (Ghȼ 376.62 ha-1). The average cost for ploughing, harrowing and ridging was Ghȼ 392.31ha-1. Transplanting and weeding cost averagely Ghȼ 523.88 ha-1 and Ghȼ 572.07 ha-1 Tono and Vea, respectively.
Fertilizer (N.P.K and Urea) is one of the most important inputs in pepper cultivation. Even though the government’s fertilizer subsidy had existed since 2008, it was repackaged under the “planting for food and jobs” programme in 2017. Accessibility of the fertilizer during dry season was however a challenge to irrigation farmers at both project areas. Farmers therefore spend averagely higher on fertilizer per hectare. At Tono the expenditure on fertilizer was higher (Ghȼ1,245.67ha-1) relative to farmers at Vea (Ghȼ 500.00ha-1) though the difference was not statistically significant. Being a perennial crop, pepper stays long on the field and therefore requires continues fertilization to induce multiple fruiting. Unlike the pepper farmers at the Tono project site, most of the pepper farmers at the Vea project site are required to return fields back the owners for field crop (cereals like millet, sorghum and maize) cultivation as soon as the raining season begins.
Pests and diseases infestation has been a major challenge affecting pepper cultivation in Ghana. Contrary to the advice by Tanzubil and Boatbil 32 that irrigation farmers in Northern Ghana devise innovative control measures against pests and diseases to minimize the negative effects of agrochemicals on their yields, farmers at the Tono and Vea project areas have adopted regular spraying their farms with agrochemicals against pests and diseases infestation. The average cost of spraying pepper farms with pesticides, fungicides, herbicides was Ghȼ 831.85 ha-1. However, the cost was averagely higher at Tono (Ghȼ 902.39 ha-1) compared to Vea project sites (Ghȼ70.00 ha-1) at 5% level of significant difference. The study observed that pepper farming was wide-spread at the Tono project sites than the Vea project site. The benefits to the farmers at the Tono project site perhaps influenced their desire to spray with more agrochemicals as the best measure to control pests and diseases to enhance fruiting than their counterparts at the Vea project site.
Table 4: Cost of Pepper Cultivation (Ghȼ ha-1)$ 1= Ghȼ 5.75.
| Irrigation Projects’ Cost of Pepper Production | |||||
| Cost Item | Total (n=59) | Tono (n=54) | Vea (n=5) | Mean diff | T value |
| Seed | 399.90 (285.42) | 411 (294.07) | 280 (124.17) | 131.90) | 0.98 |
| Land Preparation | 392.31 (370.99) | 376.62 (257.91) | 561.6 (370.99) | -184.31 | -1.48 |
| Planting (Labour) | 523.88 (447.31) | 535.11 (460.21) | 402.6 (286.37) | 132.51 | 0.63 |
| Weeding (Labour) | 572.07 (551.59) | 574.72 (564.80) | 543.4 (428.73) | 31.32 | 0.12 |
| Fertilizer | 1182.48 (1914.05) | 1245.67 (1989.76) | 500 (164.89) | 745.67 | 0.83 |
| Spraying (Chem. and Labour) | 831.85 (669.19) | 902.39 (655.74) | 70 (57.01) | 831.39** | 2.82 |
| Harvesting (Labour) | 1202.66 (893.11) | 1297.5 (874.14) | 178.4 (91.49) | 1119.1** | 2.84 |
| Water Levy | 150 | 150 | 150 | 0 | . |
| TVC | 5254.92 (3578.97) | 5462.79 (3637.38) | 2686 (1188.75) | 2806.79 | 1.71 |
Values in parentheses indicate Standard deviations
Source: Author’s computation, 2021
** are significant at 5%, level
On the average, a farmer spends Ghȼ1202.66 ha-1 to harvest pepper but the cost was higher at Tono (Ghȼ1297.50 ha-1) as compared to Vea (Ghȼ178.40 ha-1) at 5% level of significant difference. The reason for the huge difference in the cost of harvesting was partly due to the fact that the crops at Tono project stay longer on the field and farmers enjoyed multiple harvesting relative to those at the Vea project site. Overall, the average total costs of investment on inputs and labour at Vea was lower (Ghȼ2686.00 ha-1) as compared to Tono project site (Ghȼ5462.97 ha-1) but the difference was not statistically significant.
The Productivity and Profitability of Rice at Tono And Vea Projects
Table 5 shows the mean values for the production, productivity and profitability of rice (Oryza sativa) fields at the Tono and Vea irrigation projects sites. The mean size of land size per farmer for rice farming in the project areas is 0.53ha, which yields about 1636.70kg paddy rice. In other words, the mean productivity of paddy rice fields in the project areas is 3088.11kg per hectare (3.088Mt ha-1). However, yield was significantly higher at the Tono fields, averaging 1970.31kg from 0.59ha whereas the fields at the Vea project obtained as low as 833.96kg from 0.38ha. The study observed that the entire canals at the project areas were broken although those at the Tono project were relatively better. This affects farmers access to water to irrigate their fields hence affecting yields. The average productivity was 3.333Mt ha-1 at the Tono project as compared to 2.184Mt ha-1 at the Vea project at 1% level of significant difference. Although the 3.333Mt ha-1 obtained at the Tono fields is slightly higher than the national average of 2.75Mt ha-1; the output is still below the country’s achievable potential of 6Mt ha-1 25. This means pepper farmers have the opportunity to improve on the yields to raise more income from their farms in the study area.
The mean total revenue from the production of rice was Ghȼ3945.46 ha-1 but the return from Tono (Ghȼ4331.80 ha-1) was higher relative to farmers at the Vea (Ghȼ3015.81ha-1) irrigation project at 1% level of significant difference. The farmers at the Tono irrigation appear to enjoy ready market than the farmers at Vea. This perhaps encourages the farmers there to invest more on rice cultivation relative to those at the Vea project area. At the time of the study, processing companies like Avnash Company Limited in Tamale, Sunkafabono Company etc) and other women aggregators from Kumasi were available at the Tono project site to purchase paddy rice, but that was absent at the Vea project area. On the average, a gross margin of Ghȼ1041.03ha-1 was obtained at both sites but the margin at Tono was slightly higher, averaging about Ghȼ1392.32 ha-1 as compared to the farmers from the Vea irrigation area whose returns was only Ghȼ351.03 ha-1 at 1% significant difference level.
Table 5: Production, Productivity and Profitability of Rice Farms.
| Irrigation Projects | |||||
| Particulars | Total (n=109) | Tono (n=77) | Vea (n=32) | Mean diff | T-value |
| Land size (ha) | 0.53 (0.50) | 0.591 (0.538) | 0.38 (0.377) | 0.20 | 1.94 |
| Production (Kg) | 1636.70 (1999.10) | 1970.31(2230.41) | 833.963 (885.74) | 1136.34*** | 2.79 |
| Productivity (Kg/ha) | 3088.11 (1560.1) | 3333.86 (1698.89) | 2194.64 (917.74) | 877*** | 2.75 |
| Revenue (Ghȼ) | 3945.46 (2340.15) | 4331.80 (2548.33) | 3015.81 (1376.64) | 1315.99*** | 2.75 |
| Gross Margin Ghȼ) | 1041.03(2615.04) | 1392.91(2882.30) | 351.03 (1632.10) | 1041.03* | 1.91 |
Values in parentheses indicate Standard deviations
Source: Author’s computation, 2021
***, **, * are significant at 1%, 5% and 10% levels respectively.
The issue of low productivity has been a challenge to both irrigation farmers and rain-fed rice farmers rice in Ghana. ICOUR, the company managing the irrigation projects have tried to improve yields of farmers but with little success due to a number of reasons. For instance, farmers still recycle their own seeds on grounds that the improved seeds are expensive. Besides, the canal systems have not been repaired since the 1960s and 1970s when the two projects were built. Additionally, farmers hardly get extension services and credit support to access mechanisation services and other inputs like seeds, fertilizer and pesticides, thus negatively affecting the yield of farmers in the area.
The Profitability of Pepper at Tono and Vea Projects
Table 6 indicates the mean return on investment for chilli pepper (Capsicum annum) at the Tono and Vea irrigation sites. The mean land size put in the cultivation of pepper at both project areas is 0.34ha, which yields 1636.70kg of pepper. The output level is, however, higher at Tono (1564.17kg) from 0.35ha as compared to Vea (1263kg) from a land size of 0.32ha. In other words, the average productivity was 4286.00kg ha-1 at both sites but the Tono was higher (4469.068kg ha-1) compared to the Vea project site (3946.46kg ha-1) at 5% level of significant difference. The productivity of pepper at both irrigation sites is far below the national average of 8.30Mtha-1 and an achievable level of 32.0Mt ha-1 25. Several factors contribute to the low productivity of chilli pepper in the area including high incidence of nematodes, lack of high yielding seeds, inadequate application of fertilizer, among others.
Besides the fact that pepper farming is a capital-intensive enterprise, farmers sometimes suffer from low prices for the fruit. This does not incentivise farmers to invest resources to achieve good yields. For instance, the price for a bag of pepper can be as low as Ghȼ90 for an 80kg bag of fresh pepper at harvesting period, but could rises to Ghȼ250 within the same season. This notwithstanding, cumulatively the average total return from chilli pepper production was quite good, averaging Ghȼ15,571 ha-1 as a result of multiple harvesting of the fruits per season. However, the revenue at Tono (Ghȼ16,584.9 ha-1) was higher compared to the Vea (Ghȼ4,627.5 ha-1) irrigation project at 5% level of significant difference.
Table 6: Production, Productivity and Profitability of Pepper Farms.
| Irrigation projects | |||||
| Particulars | Total (n=59) | Tono (n = 54) | Vea (n = 5) | Mean diff | T-value |
| Land size (ha) | 0.34 (0.23) | 0.35 (0.24) | 0.32 (0.18) | 0.03 | 0.24 |
| Production (Kg) | 1457.24 (995.62) | 1564.17 (971.57) | 1263 (402.92) | 4279.13 | 1.58 |
| Productivity (Kg/ha) | 4286.00 (4158.96) | 4469.06 (4126.14) | 3946.88 (9646.95) | 4382.75** | 2.35 |
| Revenue (Ghȼ) | 15571.56 (12080.5) | 16584.9 (12130.8) | 4627.5 (1652.66) | 11957.4** | 2.19 |
| Gross Margin Ghȼ) | 10316.75 (12130.0) | 11122.11(12399.49) | 1941.6 (753.06) | 9150.62 | 1.64 |
Values in parentheses indicate Standard deviations
Source: Author’s computation, 2021
** are significant at 5% levels respectively
The mean gross margin was Ghȼ10,316.75ha-1, but the gross margin in Tono was much higher (Ghȼ11,122.11ha-1) compared to the Vea (Ghȼ1,941.60ha-1) at 5% significance difference. In fact, compared to rice and tomato, the cultivation of chilli pepper is much more profitable which confirms its name as the “green gold” by Asravor et al, 8. Because of that, most of the crop farmers who hitherto cultivate tomatoes at the project areas have all switched to the cultivation of chilli pepper.
Gross Margin (GM) Per Ghana Cedi Spent
Table 7 below shows the analysis of the gross margin per cedi invested on rice and pepper production per hectare at the irrigation sites. The analysis reveals that on the average, a Ghana cedi invested on rice production yields forty-three pesewas (0.43p) but the benefit is however, higher at Tono (0.47p) compared to the Vea (0.13p) project site. Again, a one cedi spent on pepper cultivation yields averagely two Ghana cedi but the Vea project site yields lower return (0.72p) per cedi invested compared to the Tono (Ghc2.03) which corroborates the findings of Asravor and Doku 8, 16 that chili pepper is profitable as such is indeed a “green gold” in Ghana if farmers intensify its cultivation.
Table 7: Net-Return (GM) per Ghana Cedi Invested.
| Irrigation Projects | ||||
| Crop | Particulars | Total | Tono | Vea |
| Rice | Gross margin per ha | 1087.32 | 1392.91 | 351.03 |
| TVC per ha | 2858.14 | 2938.82 | 2663.88 | |
| GM/TVC per cedi | 0.38 | 0.47 | 0.13 | |
| Pepper | Gross margin per ha | 10316.75 | 11122.11 | 1941.60 |
| Total cost per ha | 5254.92 | 5462.79 | 2686.00 | |
| GM/TVC per cedi | 1.96 | 2.03 | 0.72 | |
Source: Author’s Computation, 2021
Conclusion and Policy Issues
The study reveals that with an average investment of Ghȼ2,938.87ha-1 and Ghȼ2,663.88 ha-1on the fields at Tono and Vea projects would yield 3.3Mt ha-1 and 2.2Mt ha-1 of paddy rice, respectively. The returns were Ghȼ4,331.80ha-1 and Ghȼ3,015.81ha-1, resulting in gross margins of Ghȼ1392.93ha-1 and Ghȼ351.93ha-1 at Tono and Vea irrigation fields, respectively. The study also reveals that, with average investment of Ghȼ5462.79ha-1 and Ghȼ2,686ha-1 on pepper production at Tono and Vea project would result in 4.5Mt ha-1 and 3.9Mt ha-1 of fresh pepper, respectively. The returns on investments the pepper fields were Ghȼ6,584.9 and Ghȼ4,627.5, resulting in gross margins of Ghȼ11,122.11 and Ghȼ1,941.6 ha-1 at Tono and Vea projects, respectively.
The study, therefore, concludes that, a cedi invested on rice fields results in a profit of 38 pesewas at the Tono project whilst a cedi investment on rice field at Vea project give rise to 13 pesewas profit. On the other hand, the benefit from investing a cedi on pepper at Vea project was 72 pesewas whilst 2 Ghana cedi was obtained from investing a cedi at Tono project. Although both pepper and rice give higher return at the Tono project than Vea project, the research recommends that, farmers from these irrigation sites and other irrigation sites should invest their resources on the production of pepper since it gives the highest return. For production to be improved, farmers should, however, attach good farm maintenance and application of yield-booting agronomic practices such as improved seed, row planting, and application of fertilizer, among others, to improve farm productivity.
Acknowledgment
Funding Source
Thanks to Nana Osei-Bonsu, the Chief Executive Officer (CEO) of the Private Enterprise Federation (PEF) for his encouragement and financial support in terms of transport fare to the study sites. Thanks also go to Mr. Moses Agyemang, PEF’s Senior Economist, for his guidance.
Competing Interest
The author declares that there is no conflict of interest.
References
- Abdulai, S., Nkegbe, P. K., and Donkoh, S. A. (2013). Technical efficiency of maize production in Northern Ghana. African Journal of Agricultural Research 8, 5251-5259.
- Acheampong, E. N., Ozor, N., and Sekyi-Annan, E. (2014). Development of small dams and their impact on livelihoods: Cases from northern Ghana. African Journal of Agricultural Research 9, 1867-1877.
- Addison, M., Sarfo-Mensah, P., and Edusah, S. (2015). Assessing Ghana’s initiative of increasing domestic rice production through the development of rice value chain.
- Adewumi, M. O., and Adebayo, F. A. (2008). Profitability and technical efficiency of sweet potato production in Nigeria. Journal of Rural development 31, 105-120.
- Adongo, T. A., Abagale, F. K., and Kranjac-Berisavljevic, G. (2016). Performance assessment of irrigation schemes in northern Ghana using comparative performance indicators.
- Adwubi, A., Amegashie, B. K., Agyare, W. A., Tamene, L., Odai, S. N., Quansah, C., and Vlek, P. (2009). Assessing sediment inputs to small reservoirs in Upper East Region, Ghana. Lakes & Reservoirs: Research & Management 14, 279-287.
CrossRef - Al-Hassan, S. (2008). Technical efficiency of rice farmers in Northern Ghana.
- Asravor, J., Onumah, E. E., and Osei-Asare, Y. B. (2016). Efficiency of chili pepper production in the volta region of Ghana. Journal of Agricultural Extension and Rural Development 8, 99-110.
CrossRef - Ayodele, O., Ajewole, O., and Alabi, E. (2016). Cost and Benefit Analysis of Smallholder Pepper 1Production Systems. International Journal of Vegetable Science 22, 402-408.
CrossRef - Bajracharya, M., and Sapkota, M. (2017). Profitability and productivity of potato (Solanum tuberosum) in Baglung district, Nepal. Agriculture & Food Security 6, 47.
CrossRef - Berhane, G., Gebreyohannes, T., Martens, K., and Walraevens, K. (2016). Overview of micro-dam reservoirs (MDR) in Tigray (northern Ethiopia): Challenges and benefits. Journal of African Earth Sciences 123, 210-222.
CrossRef - Chiona, S. (2011). Technical and allocative efficiency of smallholder maize farmers in Zambia. Unpublished MSc Thesis, University of Zambia, Lusaka, Zambia.
- Clottey, V., Karbo, N., and Gyasi, K. (2009). The tomato industry in northern Ghana: Production constraints and strategies to improve competitiveness. African Journal of Food, Agriculture, Nutrition and Development.
CrossRef
- Connolly-Boutin, L., and Smit, B. (2016). Climate change, food security, and livelihoods in sub-Saharan Africa. Regional Environmental Change 16, 385-399.
CrossRef - Dinye, R. D., and Ayitio, J. (2013). Irrigated agricultural production and poverty reduction in Northen Ghana: A case study of the Tono Irrigation Scheme in the Kassena Nankana District. International Journal of Water Resources and Environmental Engineering 5, 119-133.
- Doku, S. K. (2015). Genetic Diversity Studies in Twenty Accessions of Hot Pepper (Capsicum Spp L.) In Ghana, University of Ghana.
- Donkoh, S. A., Ayambila, S., and Abdulai, S. (2013). Technical efficiency of rice production at the Tono irrigation scheme in northern Ghana.
CrossRef - Donkor, E., Owusu-Sekyere, E., Owusu, V., and Jordaan, H. (2016). Impact of row-planting adoption on productivity of rice farming in Northern Ghana. Review of Agricultural and Applied Economics (RAAE) 19, 19-28.
CrossRef - FAO (2014). “Ghana: Irrigation market briefReport,” Rep. No. no. 19. Food and Agriculture Organizations of United Nation, Rome.
- GEPA (2019). “Ghana Export Promotion Authority (GEPA) Report on Analysis of Non-traditional Export in 2019 “, Accra Ghana.
- Giordano, M., and de Fraiture, C. (2014). Small private irrigation: Enhancing benefits and managing trade-offs. Agricultural Water Management 131, 175-182.
CrossRef - ICOUR (1989). Irrigation Company of Upper Region (ICOUR) Hand Book (MoFA, ed.). GIDA, Ghana.
- Kyei-Baffour, N., and Ofori, E. (2006). Irrigation development and management in Ghana: prospects and challenges. Journal of science and technology (Ghana) 26, 148-159.
CrossRef - Martey, E., Kuwornu, J. K., and Adjebeng-Danquah, J. (2019). Estimating the effect of mineral fertilizer use on Land productivity and income: Evidence from Ghana. Land Use Policy 85, 463-475.
CrossRef - MoFA (2015). Agriculture in Ghana, Facts and Figures for 2015. (M. o. Agriculture, ed.). Sttistics, Research and Information DIrectorate (SRID), Ghana.
- Mutambara, S., Darkoh, M. B., and Atlhopheng, J. R. (2016). A comparative review of water management sustainability challenges in smallholder irrigation schemes in Africa and Asia. Agricultural Water Management 171, 63-72.
CrossRef - Mutiro, J., and Lautze, J. (2015). Irrigation in Southern Africa: Success or failure? Irrigation and Drainage 64, 180-192.
CrossRef - Namara, R. E., Horowitz, L., Nyamadi, B., and Barry, B. (2011). Irrigation development in Ghana: Past experiences, emerging opportunities, and future directions.
- Robinson, E. J., and Kolavalli, S. L. (2010). “Tomato in Ghana: Summary of stakeholder dialogue.” International Food Policy Research Institute (IFPRI).
- Sarr, B. (2012). Present and future climate change in the semi‐arid region of West Africa: a crucial input for practical adaptation in agriculture. Atmospheric Science Letters 13, 108-112.
CrossRef - Sekyi-Annan, E., Tischbein, B., Diekkrüger, B., and Khamzina, A. (2018). Performance evaluation of reservoir-based irrigation schemes in the Upper East region of Ghana. Agricultural Water Management 202, 134-145.
CrossRef - Tanzubil, P. B., and Boatbil, C. S. (2014). Constraints to profitable dry season tomato and pepper production in the Kasena-Nankana and Talensi districts of the Upper East Region of Ghana with emphasis on pests and diseases. Direct Res. J. Agric. Food Sci 2, 60-65.
- the United Nation (UN) (2015). Transforming our world: The 2030 agenda for sustainable development. New York: United Nations, Department of Economic and Social Affairs.
- Tilahun, Z. M. (2019). Effect of row spacing and nitrogen fertilizer levels on yield and yield components of rice varieties. World Scientific News 116, 180-193.
- Van Averbeke, W., Denison, J., and Mnkeni, P. (2011). Smallholder irrigation schemes in South Africa: A review of knowledge generated by the Water Research Commission. Water SA 37, 797-808.
CrossRef - Venot, J.-P., de Fraiture, C., and Nti Acheampong, E. (2012). Revisiting dominant notions: a review of costs, performance and institutions of small reservoirs in sub-Saharan Africa.
CrossRef - World Bank (2016). “World Bank, 2016. Africa Development Indicators. the State of the Ghanaian Economy in 2016, Institute of Statistical, Social and Economic Research Retrieved from Ghana: ,” Accra, Ghana.
CrossRef - Xie, H., You, L., Wielgosz, B., and Ringler, C. (2014). Estimating the potential for expanding smallholder irrigation in Sub-Saharan Africa. Agricultural Water Management 131, 183-193.
CrossRef - Yamane, T. (1973). Statistics: An introductory analysis.25