
Introduction
The capacity of Indian farmers to save and invest is very low. The agricultural productivity is low due to scarcity of resources and low use of resources. The farmers therefore, need credit to increase productivity and efficiency in agriculture. This need is increasing over the years with the rise in use of fertilizers, mechanisation and rise in prices. The financial requirements of the Indian farmers are for, buying agricultural inputs, additional land, supporting their families, to make improvements on the existing land, to clear old debt and purchase costly agricultural machinery, increasing the farm efficiency as against limiting resources i.e. hiring of irrigation water lifting devices, labour and machinery. Rural finance plays an important role not only increase production, storage, maintenance and marketing but contributes immensely to the merely expansion of farm income of the borrowers. Like other inputs, credit is an important input for modern agriculture. It is a fact that credit availability is not the only factor for increasing productivity but also it must be used with care for productive purpose. It’s proper and rational use can only lead to the prosperity of farm business and increase in farm income. Misuse of borrowed funds will put the farmer in trouble with burden of Credit’s cost. The credit should not act as a dead weight to the farmers but should perform dynamic and active generating role in the process of agricultural development. The main objective of the District Cooperative Agriculture and Rural Development Bank is to provide long term finance to the needy farmers, to promote the development of land, agriculture, increase the agricultural production and increase in the farm income. District Co-operative Agriculture and Rural Development Bank, Hoshangabad had registered in 24th April 1963. In the study Area, bank had provided 3514.76 [1] lac rupees to farmers as a loan for productive purpose in the Year of 2003-04 to 2012-13.Total number of cases were 2369 for various purposes like new well, tube well, pipeline, electric and diesel pump, sprinkler, thresher, tractor, diary, fisheries, horticulture, generator, machine, go downs, KCC and other purpose. District Co-operative Agriculture and Rural Development Bank, Hoshangabad has provided 4199.66 lac rupees to rural people for non agriculture purpose and total number of cases were 2680 from 2003-04 to 2012-13.
In Hoshangabad district the land is quite fertile and farmers have good canal irrigation facilities from the Narmada and Tawa rivers throughout the year. So to take advantage of this irrigation facility, most of the farmers depend on the credit for irrigation purposes like pipe line, sprinkler and electric & diesel pump etc. Due to high level of ground water farmers want to use this water through wells and tube wells so they demand for credit for these purposes. The economy of Hoshangabad district largely depends on agriculture. Hoshangabad is one of the largest producers of soya bean and pulses and other crops also produce, so farmers create credit demand for thresher tractor and other equipment which are needed in agriculture.
Once the credit is used for unspecific purposes, it not only results in low production and indebtedness of the farmer but also leads to the vicious circle of poverty. The diversion of loan to unproductive purposes has an equally adverse effect on the lending institutions that the recovery of the loan becomes difficult and this result in reduced lending capacity of the bank. The main objective of this paper was to examine the economic effect (in term of difference between net incomes before and after) on the farmers (borrowers) who took the loan from District Cooperative Agriculture and Rural Development Bank during 2005-2010.1 These data collected from Annual report of District Co-Operative Agriculture and Rural Development Bank, Hoshangabad, Madhya Pradesh, India.
Materials and Methods
This research was based on both primary and secondary data, which were collected through interview schedule and bank’s records of DCARDB, Hoshangabad. The Hoshangabad district and DCARDB was selected for this investigation purposively, as the researcher was knowing that the District Cooperative Agriculture and Rural Development Bank is functioning in this region for the last two decades and this enabled to provide the detailed and correct information to researcher on various aspects needed to fulfil the objective of this study. In order to achieve objective, simple random sampling was used for data collection from the ultimate unit i.e. borrowers (farmers).
Selection of Bank Branch
There are six branches of District Co-operative Agriculture and Rural Development Bank, Hoshangabad i.e. Itarsi, Bankhedi, Piparia, Sohagpur, Babai, Banapura. All branches were selected for the present study.
Selection of Respondents
The list of borrowers was prepared within the radius of 20 kilometres from each branch (Itarsi, Bankhedi, Piparia, Sohagpur, Babai, Banapura) of District Co-operative Agriculture and Rural Development Bank, Hoshangabad. After the preparation of list, 5 borrowers were selected randomly for each purposes (5×8) i.e. new well, electric & diesel pump set, tube well, submersible pump, sprinkler, pipe line, thresher and tractor, it means 40 borrowers from each branch were selected. Thus, the total (40×6) 240 respondents were selected for this study.
Testing of Hypothesis
Assumptions
Ho: There is no significant difference between net income of sample farmers before and after taking loan for different purposes
H1: There is significant difference between net income of sample farmers before and after taking loan for different purposes
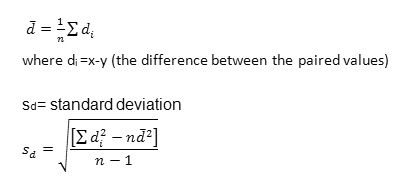
Data collected were analyzed using descriptive statistics (mean, and standard deviation and paired t-test statistics) so as to evaluate economic effect of the loan on sample borrowers in Hoshangabad district. A hypothesis was tested using the paired t-test statistics with n-1 degree of freedom. All the analysis were done using maxstat lite version 3.60.
Paired t-test
Where
n = number of samples
Results
Before studying the net income of borrowers, there is need to discuss the profile, income, expenditure and loan details of borrowers before and after taking loan purpose wise. The table 1 to 8 are the shortcut economic presentation of the sample and the impact of loan is found by comparing the situation sample farmers on the basis of various factors namely size holding, value of land, net area sown, net area irrigated, double cropped area, cropping intensity, production, loan applied for and sanctioned limit of the loan. The situations which existed before the advancement of loan and after advancement of loan are compared and the impact is formulated by the difference of these two situations. If the impact is on positive side is favourable it is marked as (+) and negative or unfavourable impact is represented by (-).
Table 1, shows that the average size of holding was remained same as before i.e. 3.59 ha in digging of new wells category. It is also cleared from table 1, the sanctioned amount was nearly 69.46 percent of the total loan applied for the digging well. The average gross cropped area, net sown area , irrigated area 1.275 average area under hybrid variety were also increased by 0.34, 0.16 and 0.67, 1.275 ha. respectively. The cropping intensity was raised by 3 percent. The average production of sample farmers was 226.57q/borrower and 63.15 q/ha before taking loan. however it was increased by 49.7 q/borrower and 13.85 q/ha and the values of production was increased by Rs. 32,119/borrower and Rs. 8,952/ha. The irrigation by well had positive effect on the farmers. It was found that the net income of Rs.20,269/borrower and Rs.5,649/ha was increased due the irrigation facility of well. This is not surprising as the irrigation has great potential of raising production directly or indirectly through intensive management of crops. The loan advanced for digging of wells facilitates adoption of new technology and returns.
It is observed from table 2, the sanctioned amount was nearly 90 percent of the total loan applied for purchasing of electric and diesel pump. Size of land holding, gross cropped area, net sown area, net area under irrigation and net area under hybrid variety were increased by 0.413,0.168, 0.073, 0.455 and 0.387 ha/borrower respectively. Total production was increased by 17.99 q/borrower and 3.68q/ha. and the value of the average production of sample farmers was increased by Rs. 17,960/borrower and Rs. 465/ha. Total expenditure was increased by Rs.5.366/borrower and decreased by Rs. 396/ha. Thus, irrigation facility in purchase of electric and diesel pump had positive effect on the farmers due to increment in net income i.e. Rs.48,103/borrower and Rs.24,740/ha.
Table 3 shows that the farmers taken the loan for installation of tube wells land holding increased by 0.327/borrower. The sample farmers applied for total loan of 2182 thousand rupees against the sanctioned amount of 1963.8 thousand rupees. this was nearly 90 percent of the total loan. gross cropped area, net sown area, net area under irrigation and net area under hybrid variety were increased by 0.977, 0.167, 0.88 and 0.42 ha/borrower. After taking loan, the total production and the value of average production were increased by 81.02 q/borrower and 11.49 q/ha and Rs. 62,378/borrower and Rs. 10,111/ha respectively. Due to increase in net sown area, the expenditure was also increased by Rs. 27,915/borrower and Rs.4,862/ha. Net income of sample borrowers was also increased by Rs. 34,463/ borrower and Rs. 5249/ha. Thus, irrigation with tube well had positive effect on the farmers.
Table 1: Analysis of loan received for new well by sample farmer from bank.
| Particulars |
Before taking loan |
After taking loan |
Impact / changes |
||||||
|
Total |
Per sample borrower |
Per ha. |
Total |
Per sample borrower |
Per ha. |
Total |
Per sample borrower |
Per ha. |
|
| No. of borrowers |
30 |
– |
– |
30 |
– |
– |
30 |
– |
– |
| Size of holding (ha.) |
107.64
|
3.59 |
– |
107.64
|
3.59 |
– |
0 |
0 |
– |
| Gross cropped area (ha) |
131.96 |
4.40 |
– |
142.36 |
4.75 |
– |
10.4(+) |
0.34(+) |
– |
| Net area sown crop (ha) |
88.96 |
2.97 |
– |
93.8 |
3.13 |
– |
4.84(+) |
0.16(+) |
– |
| Net irrigated area (ha) |
43 |
1.43 |
– |
63 |
2.1 |
– |
20(+) |
0.67(+) |
– |
| Net area under hybrid crop (ha) |
26 |
0.87 |
– |
64.25 |
2.14 |
– |
38.25(+) |
1.28(+) |
– |
| C.I. (%) |
148 |
– |
– |
152 |
– |
– |
3.4(+) |
– |
– |
| Total production(q) |
6,797 |
227 |
63 |
8,288 |
276 |
77 |
1491(+) |
49.7 (+) |
13.85(+) |
| Value of product(Rs.) |
50,39,074 |
1,67,969 |
46,814 |
60,02,640 |
2,00,088 |
55,766 |
9,63566(+) |
32,119(+) |
8,952(+) |
| Total expenditure(Rs.) |
22,03,568 |
73,452 |
20,472 |
25,59,063 |
85,302 |
23,774 |
3,55495(+) |
11,850(+) |
3,303(+) |
| Net income(Rs.) |
28,35,506 |
94,517 |
26,342 |
34,43,577 |
1,14,786 |
31,992 |
6,08071(+) |
20,269(+) |
5,649(+) |
| Loan applied (Rs.) |
11,56,000 |
38,533 |
10,740 |
– |
– |
– |
– |
– |
– |
| Sanctioned loan(Rs.) |
8,03,000 |
26,767 |
6,714 |
– |
– |
– |
– |
– |
– |
Table 2: Analysis of loan received for electric & diesel pump by sample farmer from bank.
| Particulars |
Before taking Loan |
After taking Loan |
Impact / Changes |
||||||
|
Total |
Per sample borrower |
Per ha. |
Total |
Per sample borrower |
Per ha. |
Total |
Per sample borrower |
Per ha. |
|
| No. of borrowers |
30 |
– |
– |
30 |
– |
– |
– |
– |
|
| Size of holding (ha.) |
44.61 |
1.48 |
– |
57 |
1.9 |
– |
12.39(+) |
0.413(+) |
– |
| Gross cropped area (ha) |
44.75 |
1.491 |
– |
49.8 |
1.66 |
– |
5.05(+) |
0.168(+) |
– |
| Net area sown crop (ha) |
30.95 |
1.031 |
– |
33.15 |
1.105 |
– |
2.2(+) |
0.073(+) |
– |
| Net irrigated area (ha) |
12.1 |
0.40 |
– |
25.75 |
0.86 |
– |
13.65(+) |
0.455(+) |
– |
| Net area under hybrid crop (ha) |
5.3 |
0.18 |
– |
16.9 |
0.56 |
– |
11.6(+) |
0.387(+) |
– |
| C.I. (%) |
145 |
– |
– |
150 |
– |
– |
5(+) |
– |
– |
| Total production(q) |
1,189 |
39.63 |
26.65 |
1728.7 |
57.62 |
30.33 |
539.71(+) |
17.99(+) |
3.68(+) |
| Value of product(Rs.) |
18,44, |
61,481 |
41,346 |
23,83,221 |
79,441 |
41,811 |
5,38,793(+) |
17,960(+) |
465(+) |
| Total expenditure(Rs.) |
66,0,799 |
22,026
|
14,813 |
8,21,779 |
27,393 |
14,417 |
1,60,980(+) |
5,366(+) |
396(-) |
| Net income(Rs.) |
1,18,363 |
3,945 |
26,053 |
15,61,442 |
52,048 |
27,394 |
14,43,079(+) |
48,103(+) |
24,740(+) |
| Loan applied (Rs.) |
3,94,000 |
13,133 |
8,832 |
– |
– |
– |
– |
– |
– |
| Sanctioned loan(Rs.) |
3,54,600 |
11,820 |
7,949 |
– |
– |
– |
– |
– |
– |
Table 3: Analysis of loan received for tube well by sample farmer from bank.
|
Particulars
|
Before Taking Loan |
After Taking Loan |
Impact / Changes |
||||||
|
Total |
Per sample borrower |
Per ha. |
Total |
Per sample borrower |
Per ha. |
Total |
Per sample borrower |
Per ha. |
|
| No. of borrowers |
30 |
– |
– |
30 |
– |
– |
– |
– |
– |
| Size of holding (ha.) |
133.047 |
4.43 |
– |
142.85 |
4.76 |
– |
9.803(+) |
0.327(+) |
– |
| Gross cropped area (ha) |
119.3 |
3.98 |
– |
148.6 |
4.93 |
– |
29.3(+) |
0.977(+) |
– |
| Net area sown crop (ha) |
83.1 |
2.77 |
– |
89 |
2.97 |
– |
5.9(+) |
0.197(+) |
– |
| Net irrigated area (ha) |
33.4 |
1.11 |
– |
59.8 |
1.99 |
– |
26.4(+) |
0.88(+) |
– |
| Net area under hybrid crop (ha) |
26.6 |
0.89 |
– |
39.2 |
1.31 |
– |
12.6(+) |
0.42(+) |
– |
| C.I. (%) |
143.56 |
– |
– |
166.97 |
– |
– |
23.40(+) |
– |
– |
| Total production(q) |
10,707 |
356.9 |
80.48 |
13,138 |
437.92 |
91.97 |
2,430.55(+) |
81.02(+) |
11.49(+) |
| Value of product(Rs.) |
57,94,623 |
1,93,154 |
43,553 |
76,65,969 |
2,55,532 |
53,664 |
18,71,346(+) |
62,378(+) |
10,111(+) |
| Total expenditure(Rs.) |
19,39,020 |
64,634 |
14,574 |
27,76,478 |
92,549 |
19,436 |
8,37,458(+) |
27,915(+) |
4,862(+) |
| Net income(Rs.) |
38,55,603 |
1,28,520 |
28,979 |
48,89,491 |
1,62,983 |
34,228 |
10,33,888(+) |
34,463(+) |
5,250(+) |
| Loan applied (Rs.) |
21,82,000 |
72,733.33 |
16,400 |
– |
– |
– |
– |
– |
– |
| Sanctioned loan(Rs.) |
19,63,800 |
65,460 |
14,760 |
– |
– |
– |
– |
– |
– |
Lifting of water from the wells or from any other source is a crucial problem even if the water source is enough for irrigation. Pump sets are needed for water lifting purpose. Due to availability of electricity in rural areas, the demand of finance for submersible pump had increased. The sanctioned amount was nearly 79.66 percent of the total loan applied for installation of submersible pumps. The farmers had the land holding of 48.3 ha who were taken loan for submersible pumps and it was increased by 3.7 ha in the study area and gross cropped area, net sown area, net area under irrigation and net area under hybrid variety were also increased by 0.28, 0.11, 0.35 and 0.42 ha/borrower. The total production of crops was increased by 32 q/ borrower and 12 q/ha. and the value of, average production was increased by Rs. 13, 789/borrower and Rs. 3658/ha Before taking loan, the expenditure was Rs. 33.645/borrower and Rs. 20,897/ha and the expenditure was increased by Rs. 7,500/borrower and Rs. 2,840/ha due to increase in net sown area.Net income of sample borrowers was also increased by Rs. 6,290/borrower and Rs. 8,19/ha Thus, irrigation with submersible pump had positive effect on the farmers.
Table 5 shows that sanctioned amount was nearly 97.67 percent of the total loan applied for Pipe line. In this category of loan size of land holding was increased by very less amount this was only 0.103 ha/borrower. Same as changes in land holding gross cropped area, net area sown, net area under irrigation and area under hybrid variety were also increased by 1.13, 0.57, 1.12 and 0.627 ha/ borrower. Total production increased by 130.13 q/borrower and 24.14 q/ha and the value of the average production of sample borrowers increased from Rs.2,02,880 to Rs. 2,91,106/borrower and Rs.39,908 to 56,129 /ha. The additional gain in the value of average production due to purchase of pipeline on the sample farm was Rs. 88,225/borrower and 16,221/ha, which resulted in additional income per farm was Rs. 24305 and 35,866/ha. Total expenditure was increased by Rs.25,766/borrower and Rs. 4,659/ha. and net income was increased by Rs.62,460/borrower and Rs.11,562/ha.
Table 6 shows that the sanctioned amount was nearly 88.64 percent of the total loan applied for Sprinkler irrigation system. Size of land holding increased by 0.23 ha/borrower and gross cropped area, net area sown, net area under irrigation and area under hybrid variety were also increased by 0.5, 0.13, 0.52 and 0.45 ha/ borrower. The production of crops was increased by 79.4 qt/ borrower and 22.04 qt/ha. of sample borrower and the value of average production was increased by Rs.42,312 / borrower and Rs 10,993 / hectare. The expenditure was also increased by Rs. 15,463/borrower and Rs.3,934/ha of sample borrower due to increase in net sown area. Net income before taking loan was Rs. 73,484/borrower and Rs. 27,779/ha. but it was increased by Rs. 26,849/borrower and Rs. 7,059/ha. Thus, the sprinkler irrigation facility had positive effect on the income of farmers.
Table 4: Analysis of loan received for submersible pump by sample farmer from bank.
| Particulars |
Before Taking Loan |
After Taking Loan |
Impact / Changes |
||||||
|
Total |
Per sample borrower |
Per ha. |
Total |
Per sample borrower |
Per ha. |
Total |
Per sample borrower |
Per ha. |
|
| No. of borrowers |
30 |
– |
– |
30 |
– |
– |
– |
– |
– |
| Size of holding (ha.) |
48.3 |
1.61 |
– |
52 |
1.73 |
– |
3.7 |
0.12 |
– |
| Gross cropped area (ha) |
51.8 |
1.73 |
– |
60.3 |
2.01 |
– |
8.5 |
0.28 |
– |
| Net area sown crop (ha) |
31.8 |
1.06 |
– |
35 |
1.17 |
– |
3.2 |
0.11 |
– |
| Net irrigated area (ha) |
9.4 |
0.31 |
– |
19.8 |
0.66 |
– |
10.4 |
0.35 |
– |
| Net area under hybrid crop (ha) |
10 |
0.33 |
– |
22.5 |
0.75 |
– |
12.5 |
0.42 |
– |
| C.I. (%) |
162.89 |
– |
– |
172.29 |
– |
– |
9.39 |
0.31 |
– |
| Total production(q) |
4,367.18 |
145.57 |
90.42 |
5,326.99 |
177.57 |
102.44 |
960 |
32 |
12.02 |
| Value of product(Rs.) |
29,16,830 |
97,228 |
60,390 |
33,30,514 |
1,11,017 |
64,048 |
4,13,684 |
13,789 |
3,658 |
| Total expenditure(Rs.) |
10,09,336 |
33,645 |
20,897 |
12,34,334 |
41,144 |
23,737 |
2,24,998 |
7,500 |
2,840 |
| Net income (Rs.) |
19,07,494 |
63,583 |
39,493 |
20,96,180 |
69,873 |
40,311 |
1,88,686 |
6,290 |
819 |
| Loan applied (Rs.) |
7,00,500 |
23,350 |
14,503 |
– |
– |
– |
– |
– |
– |
| Sanctioned loan (Rs.) |
5,58,000 |
18,600 |
11,553 |
– |
– |
– |
– |
– |
– |
Table 5: Analysis of loan received for pipe line by sample farmer from bank.
| Particulars |
Before Taking Loan |
After Taking Loan |
Impact / Changes |
||||||
|
Total |
Per sample borrower |
Per ha. |
Total |
Per sample borrower |
Per ha. |
Total |
Per sample borrower |
Per ha. |
|
| No. of borrowers |
30 |
– |
– |
30 |
– |
– |
– |
– |
|
| Size of holding (ha.) |
152.51 |
5.08 |
– |
155.59 |
5.19 |
– |
3.08 |
0.103 |
|
| Gross cropped area (ha) |
143.3 |
4.78 |
– |
177.2 |
5.91 |
– |
33.9 |
1.13 |
|
| Net area sown crop (ha) |
89.4 |
2.98 |
– |
106.6 |
3.55 |
– |
17.2 |
0.57 |
|
| Net irrigated area (ha) |
43 |
1.43 |
– |
76.6 |
2.55 |
– |
33.6 |
1.12 |
|
| Net area under hybrid crop (ha) |
44.34 |
1.48 |
– |
63.15 |
2.105 |
– |
18.81 |
0.627 |
|
| C.I. (%) |
160.29 |
– |
– |
166.23 |
– |
– |
|||
| Total production(q) |
7279.18 |
242.64 |
47.73 |
11,183 |
373 |
71.87 |
3904 |
130.13 |
24.14 |
| Value of product (Rs.) |
60,86,411 |
2,02,880 |
39,908 |
87,33,172 |
2,91,106 |
56,129 |
26,46,761 |
88,225 |
16,221 |
| Total expenditure (Rs.) |
23,79,732 |
79,324 |
15,604 |
31,52,705 |
1,05,090 |
20,263 |
7,72,973 |
25,766 |
4,659 |
| Net income(Rs.) |
37,06,679 |
1,23,556 |
24,305 |
55,80,467 |
1,86,016 |
35,866 |
18,73,788 |
62,460 |
11,562 |
| Loan applied (Rs.) |
20,13,000 |
67,100 |
13,199 |
– |
– |
– |
|||
| Sanctioned loan(Rs.) | 19,66,000 |
65,533 |
12,891 |
– |
– |
– |
|||
Table 6: Analysis of loan received for sprinkler by sample farmer from bank.
| Particulars |
Before Taking Loan |
After Taking Loan |
Impact / Changes |
||||||
|
Total |
Per Sample borrower |
Per ha. |
Total |
Per Sample borrower |
Per ha. |
Total |
Per Sample borrower |
Per ha. |
|
| No. of borrowers |
30 |
– |
– |
30 |
– |
– |
|||
| Size of holding (ha.) |
79.36 |
2.65 |
– |
86.4 |
2.88 |
– |
7.04 |
0.23 |
– |
| Gross cropped area (ha) |
87.8 |
2.93 |
– |
102.8 |
3.43 |
– |
15 |
0.5 |
– |
| Net area sown crop (ha) |
56.4 |
1.88 |
– |
60.4 |
2.01 |
– |
4 |
0.13 |
– |
| Net irrigated area (ha) |
21 |
0.7 |
– |
36.6 |
1.22 |
– |
15.6 |
0.52 |
– |
| Net area under hybrid crop (ha) |
19.46 |
0.65 |
– |
33 |
1.1 |
– |
13.54 |
0.45 |
– |
| C.I. (%) |
155.67 |
– |
– |
170.20 |
– |
– |
14.52 |
– |
– |
| Total production (q) |
5,390 |
179.67 |
67.92 |
7,772 |
259.07 |
89.95 |
2,382 |
79.4 |
22 |
| Value of product(Rs.) | 36,02,218 |
1,20,074 |
45,391 |
48,71,588 |
1,62,386 |
56,384 |
12,69,370 |
42,312 |
10,993 |
| Total expenditure(Rs.) |
13,97,700 |
46,590 |
17,612 |
18,61,592 |
62,053 |
21,546 |
4,63,892 |
15,463 |
3,934 |
| Net income (Rs.) |
22,04,518 |
73,484 |
27,779 |
30,09,996 |
1,00,333 |
34,838 |
8,05,478 |
26,849 |
7,059 |
| Loan applied (Rs.) |
11,23,600 |
37,453 |
14,158 |
– |
– |
– |
– |
– |
– |
| Sanctioned loan (Rs.) |
9,96,000 |
33,200 |
12,550 |
– |
– |
– |
– |
– |
– |
Thresher was devised for the separation of grain from stalks and husks. In this category the size of holding was increased by 0.15 ha/borrower. In other words, only the big sized farmers demanded funds for purchase of thresher and allied implements. As shown in table 7, the sanctioned amount was nearly 82.59 percent of the total loan applied for the purpose. Gross cropped area, net area sown, net area under irrigation and area under hybrid variety were also increased by 0.356, 0.08, 0.26 and 0.14 ha/ borrower. Total production was increased by 44.13 qt/borrower and 7.31 qt/ha. and the additional gain in the value of average production due to purchase of thresher on the sample farm was Rs. 40,992/borrower and Rs. 7,998/ha. The additional expenditure in the value of average production due to purchase of thresher on the sample farm was Rs. 14,141/borrower and Rs. 2,706/ha. Net income before taking loan was Rs. 1,37,688/borrower and Rs. 35,274/ha, however, it was increased by Rs. 1,37,688/borrower and Rs. 35,274/ha.
Table 7: Analysis of loan received for thresher by sample farmer from bank.
| Particulars(amt.) |
Before Taking Loan |
After Taking Loan |
Impact / Changes |
||||||
|
Total |
Per sample borrower |
Per ha. |
Total |
Per sample borrower |
Per ha. |
Total |
Per sample borrower |
Per ha. |
|
| No. of borrowers |
30 |
– |
– |
30 |
– |
– |
– |
– |
– |
| Size of holding (ha.) |
117.1 |
3.9 |
– |
121.56 |
4.056 |
– |
4.58(+) |
0.15(+) |
– |
| Gross cropped area (ha) |
153.52 |
5.12 |
– |
164.2 |
5.47 |
– |
10.68(+) |
0.356(+) |
– |
| Net area sown crop (ha) |
91.62 |
3.05 |
– |
93.98 |
3.13 |
– |
2.36(+) |
0.08(+) |
– |
| Net irrigated area (ha) |
52.5 |
1.75 |
– |
60.3 |
2.01 |
– |
7.8(+) |
0.26(+) |
– |
| Net area under hybrid crop(ha) |
49.9 |
1.66 |
– |
54.2 |
1.8 |
– |
4.3(+) |
0.14(+) |
– |
| C.I. (%) |
167.56 |
– |
174.72 |
– |
– |
7.16(+) |
– |
– |
|
| Total production(q) |
11,123 |
370.77 |
94.99 |
12,447 |
412.99 |
102.29 |
1,324(+) |
44.13(+) |
7.31(+) |
| Value of product(Rs.) |
65,60,013 |
2,18,667 |
56,021 |
77,89,775 |
2,59,659 |
64,019 |
12,29,762(+) |
40,992(+) |
7,998(+) |
| Total expenditure(Rs.) |
24,29,381 |
80,979 |
20,746 |
28,53,620 |
95,121 |
23,452 |
4,24,240(+) |
14,141(+) |
2,706(+) |
| Net income (Rs.) |
41,30,633 |
1,37,688 |
35,274 |
49,36,155 |
1,64,539 |
40,567 |
8,05,522(+) |
26,851(+) |
5,292(+) |
| Loan applied (Rs.) |
20,59,500 |
68,650 |
17,588 |
– |
– |
– |
– |
– |
– |
| Sanctioned loan(Rs.) |
17,01,000 |
56,700 |
14,526 |
– |
– |
– |
– |
– |
– |
Table 8: Analysis of loan received for tractor by sample farmer from bank.
| Particulars(amt.) |
Before Taking Loan |
After Taking Loan |
Impact / Changes |
||||||
|
Total |
Per sample borrower |
Per ha. |
Total |
Per sample borrower |
Per ha. |
Total |
Per sample borrower |
Per ha. |
|
| No. of borrowers |
30 |
– |
– |
30 |
– |
– |
– |
– |
– |
| Size of holding (ha.) |
177.94 |
5.93 |
– |
184.95 |
6.16 |
– |
7.008(+) |
0.23(+) |
– |
| Gross cropped area (ha) |
202.6 |
6.75 |
– |
244 |
8.13 |
– |
41.4(+) |
1.38(+) |
– |
| Net area sown crop (ha) |
124.4 |
4.15 |
– |
144.2 |
4.81 |
– |
19.8(+) |
0.66(+) |
– |
| Net irrigated area (ha) |
97 |
3.23 |
– |
114.4 |
3.81 |
– |
17.4(+) |
0.58(+) |
– |
| Net area under hybrid crop(ha) |
69.3 |
2.31 |
– |
86 |
2.87 |
– |
16.7(+) |
0.56(+) |
– |
| C.I. (%) |
162.86 |
– |
– |
169.21 |
– |
– |
6.35(+) |
– |
– |
| Total production(q) |
10,057 |
335.23 |
56.52 |
13,815 |
460.5 |
74.70 |
3,758(+) |
125.27(+) |
18.18(+) |
| Value of product(Rs.) |
84,66,514 |
2,82,217 |
47,580 |
1,04,40,054 |
3,48,002 |
56,448 |
19,73,540 |
65,785 |
8,868(+) |
| Total expenditure(Rs.) |
31,74,909 |
1,05,830 |
17,842 |
38,48,415 |
1,28,281 |
20,808 |
6,73,506 |
22,450 |
2,965(+) |
| Net income(Rs.) |
52,91,605 |
1,76,387 |
29,738 |
65,91,639 |
2,19,721 |
35,640 |
13,00,034 |
43,334 |
5,902(+) |
| Loan applied (Rs.) | 1,95,56,000 |
6,51,867 |
1,09,902 | – | – | – | – | – | – |
| Sanctioned loan(Rs.) | 1,29,70,000 |
4,32,333 |
72,889 | – | – | – | – | – | – |
Table 8 also reveals that the sanctioned amount was nearly 66.32 percent of the total loan applied for purchasing of tractor. Size of land holding, gross cropped area, net area sown, net area under irrigation and area under hybrid variety were also increased by 0.23, 1.38, 0.66, 0.58 and 0.56 ha/ borrower. For this purpose the production of crops was increased by 125.27 q/ borrower and 18.18 q/ha. and the value of, average production was increased by Rs. 65,785/ borrower and Rs. 8,868/ha. Before taking loan, the expenditure was Rs. 1, 05,830/borrower and Rs. 29,738/ha. Additional expenditure was also increased by Rs. 22,450/borrower and Rs. 2,965/ha with the purchase of tractor. . Net income before taking loan was Rs. 73,484/borrower and Rs. 27,779/ha but it was increased by Rs. 43,334/borrower and Rs. 5,902/ha. The long term loan had positive influence on the loan borrower farmers
After studying profile, production, income and expenditure of borrowers before and after taking loan, the assumption of H1 hypothesis proved correct that there is significant difference between the net income before and after loan of cooperative farmers for different purposes. To test the hypothesis the paired t-test statistics was employed. The paired t-test values of net income of borrowers before and after taking loan are presented in table 9.
The result of the test shows that for the purposes of digging of new well, submersible pump and thresher, the t-calculated values were 1.815, 0.857 and 1.683 which were statistically non-significant respectively means no differences in the net income of before and after taking loan of the farmers. Paired “t” value for purchasing of electric & diesel pump, digging of tube well, sprinkler, pipeline and tractor were 2.648 and 2.835, 3.091, 3.5, and 2.220 respectively statistically significant.
Table 9: Paired t-test Values of net income of borrowers before and after taking loan.
| Variables |
Mean + SD of before taking loan
|
Mean + SD of after taking loan
|
Mean difference
|
95% confidence interval of the mean difference |
Lower range
|
Upper range |
t value |
p value |
Are the mean difference (p<0.05) |
| New well |
94517+63112
|
114785+65888 |
20269 |
+22838 |
-2569 |
43107 |
1.815 |
0.0799 |
NO |
| Electric &diesel pump |
39454+25800 |
52048+25660 |
12594 |
+9728 |
2866 |
22321 |
2.648 |
0.0130 |
YES |
| Tube well |
128520+103485
|
162983+114468 |
34463 |
+24861 |
9601 |
59325 |
2.835 |
0.0083 |
YES |
| Submersible pump |
63583+57093 |
69873+45437 |
6290 |
+15006 |
-8717 |
21296 |
0.857 |
0.3984 |
NO |
| Sprinkler |
73484+56310
|
100333+60304
|
26849 |
+17768 |
9081 |
44617 |
3.091 |
0.0044 |
YES |
| Pipe line |
1235566+183857
|
186016+147977 |
62450 |
+36503 |
25957 |
98962 |
3.500 |
0.0015 |
YES |
| Thresher |
137688+101729
|
164539+102813 |
26851 |
+32632 |
-5781 |
59482 |
1.683 |
0.1031 |
NO |
| Tractor |
176387+90389 |
219721+95041 |
43334 |
+39914 |
3420 |
83248 |
2.220 |
0.034 |
YES
|
Discussion
Table 1-8, explain that maximum average size of land holding was 5.93 ha/borrower in tractor category followed by 5.08 ha/borrower in pipeline category, 4.43 ha/borrower in tube well category, 3.9 ha/borrower in thresher category 3.59 ha/borrower in new wells category, 2.65 ha/borrower in sprinkler category, 1.61 ha/borrower in submersible pump category and the minimum average size 1.48 ha/borrower in electric & diesel pump category but average size of land holdings were increased by 0.23 ha./borrower in tractor category, 0.103 ha./borrower in pipeline category, 0.327 ha/borrower in tube well category, 0.15 ha/borrower in thresher category 0.00 ha/borrower in new wells category, 0.23 ha/borrower in sprinkler category, 0.12 ha/borrower in submersible pump category and the minimum average size 0.413 ha/borrower in electric & diesel pump category. So we can say that electric & diesel pump category had lowest average size of land holding but maximum changes were shown in this category.
We can see that from table 1- 8, sample farmers got maximum net income of Rs. 62,460/borrower for the purpose of pipeline followed by Rs. 48,103/borrower for the purpose of electric & diesel pump, Rs. 43,334/ borrower for the purpose of tractor, Rs. 34,463/borrower for the purpose of tube well, Rs. 26,851/borrower for the purpose of thresher, Rs. 26,849/borrower for the purpose of sprinkler, Rs. 20,269/borrower for the purpose of new well, Rs. 6,290/borrower for the purpose of submersible pump and maximum net income of Rs. 24,740/ha. for electric &diesel pump followed by 11,562/ha for pipeline, Rs. 7,059/ha. for sprinkler, Rs. 5,902/ha for tractor, Rs. 5,649/ha. for new well, Rs. 5,292/ha. for thresher, Rs. 5,250/ha. for tube well, Rs. 819/ha for submersible pump.
For the three purposes out of eight, the digging of new well, purchase of submersible pump and thresher purposes the assumption of hypothesis H0, in the results given with all the three income increased was accepted. This implies that there is no significant difference between the net income before and after taking loan by the cooperative farmers with non significant t-calculated value at 95 % level of significance. The reason for not significant difference between net incomes before and after taking loan of sample borrowers of new dug wells was, in the study area out of 30 dug wells, 6 wells had no water potential so investment of loan into digging new wells was wasted. The reason for submersible pump was, lifting of water from the wells or from any other source is a crucial problem due to not enough fitting of pipeline for irrigation in the study area and for thresher the reason was the minute difference between production i.e. production increased by only 1324 qt. because thresher has no directly effect on production. Other reasons were diversion of loan sanctioned, and fluctuations of prices for agricultural commodities etc during study period. The hypothesis was rejected it means, the t-calculated value was significant at 95 % level for electric & diesel pump, tube well, sprinkler, pipe line, and Tractor (Table 9). This implies that there is a significant difference between the income before And after taking loan by the cooperative farmers due to proper and timely utilization of pump, tube well, sprinkler, pipe line, and tractor and other reason To increase the income by giving on rent for use of electric & diesel pump and tractor to others.
Conclusion
On the basis of findings of this study, it can be concluded that credit is very useful in the modernization of agriculture and increasing the participation of small farmers in the production process. The long term credit had positive effect on net income of borrowers for electric & diesel pump, tube well, sprinkler, pipe line and tractor and negative effect on net income of borrowers for new well, submersible pump and thresher and credit could be an effective tool for development of agriculture if it is distributed with justice.
Acknowledgements
The authors are thankful to Dr. A.K. Singh, Vice chancellor of R.V.S.K.V.V Gwalior and Dr. J. P. Dixit, Dean College of Agriculture Gwalior for providing facilities to complete the research work successfully. The authors are also thankful to all the branch managers of the District Cooperative Agriculture and Rural development Banks, Hoshangabad district (M.P.) for providing valuable previous data for this research work. And last but not least, thankful to all the borrowers who gave us their time and suggestion in collection of data.
References
- Ahmad A, Anwar A. Impact of Supervised Agricultural Credit on Farm Income in the Barani Areas of Punjab” Pakistan Journal of Social Sciences (PJSS) December 2011; 31(2): 241-250.
- Bisen R. “An analysis of utilization of loan provided by Central Cooperative Land Development Bank, branch Balaghat, M.P.” M. Sc. (Ag.) thesis, deptt. of Agricultural Economics And Farm Management, JNKVV, Jabalpur, M.P. 1977
- Chakravarti S. Role of District Central Cooperative Banks on Distribution of Agricultural Loan” Indian Cooperative Review, New Delhi June 1976; XXX (1):449
- Gaven I., The Impact of Agricultural Loan and Advances in Sri Lanka. International Food Policy Research Institute (IFPRI) Washington December 1979; 13
- MuniRaj R., Problem of financing agriculture by commercial banks financing agriculture, April 1970 II (1): 19.
- Simonyan B., Omolehin A., Analysis of Impact of Fadama II Project on Beneficiary Farmers Income in Kaduna State: A Double Difference Method Approach. International Journal of Economics and Management Science, 2012; 1(11):01-08.