
Introduction
Tomato (Lycopersicum esculentum) belongs to Solanaceous family, the tomato is utmost extensively used as a food crop. As tomato is a climacteric and perishable vegetable, it is prone to degradation in a small amount of time accounting to be 14 to 21 days.1 In fact, tomatoes are known to possess a high quantity of sugar and acid contents which are the main factors contributing to its flavor.2 Keeping the fresh appearance of tomatoes along with its nutrition even after harvesting is an undying task imposed by the consumers. External appearance, quality and nutritional content of tomato fruits can be maintained by controlled storage temperature.3 Moreover, the temperature controlled environment has been known to have a direct control of the metabolic activities in the tomatoes and thus proven to enhance the shelf life of the tomatoes with preserved nutritional qualities. Further, it is undeniably one of the most significant measures invoked in maintaining and even augmenting the shelf-life of tomatoes.4
Numerous biochemical and physiological processes of fruits and vegetables are controlled by the association of calcium ion which is believed to play a key role in retaining quality. The rate of ethylene production and respiration in tomato fruits reportedly decreased by increasing the level of calcium ions.5 Thus, treatment of fruits with CaCl2 resulted in improving the firmness of the fruits and decreased deteriorations physiologically thereafter leading to reduced respiration, decrement in ethylene production, and delay in fruit ripening.6 Various investigations revealed that calcium chloride treatment on tomato reduced post-harvest decay quantitatively in terms of development in the lycopene and ascorbic acid content, controlled development of physiological disorders, strengthening of the skin constituting cell walls, and providing the tissues with improved resistance, reduced production of enzymes which thus limit infections, control ripening, and rotting thus inevitably improving the quality and shelf-life of tomato.7 In parallel, storage temperature is an important factor in maintaining quality and increasing the shelf life of tomatoes by reducing moisture loss and decelerating biochemical changes during ripening. In the context of two varieties of the tomatoes abundantly consumed in India, we conducted the CaCl2 treatment on them to find the optimum storage temperature and biochemical changes for ensuring better quality for consumption with optimized shelf life.
Materials and Methods
The experiments were conducted in the research laboratory of the SHUATS, Allahabad. Two cultivars of tomato fruit(L. esculentum) namely Hisar arun, (a Local variety) and Kashi Vishesh, (a hybrid variety) were harvested from the experimental field of Department of Forestry in SHUATS (25°24’50.4″N, 81°50’58.5″E). Following the color based maturity stages, as prescribed in the USDA color chart,8 we picked the tomatoes corresponding to three particular maturity stages visually namely Green (Mature Green), Breaker and Red (Mature red) and further graded according to shape size, color, and appearance. After grading, tomatoes were washed with water and air dried. Next, the tomatoes were treated with 1%, 2% and5% CaCl2 solution for 15 minutes and stored at 5°C, 10°C, and 15°C temperatures for 21 days, the analysis was done after every 7 days. The storage duration is chosen to be 21 days in order to perform a comprehensive comparison for all the maturity stages of the tomatoes as, after this time duration, the sample of the mature red stage of tomatoes would succumb to degradation and fungal activities. Over-ripened tomatoes of different treatments with the passage of time during storage were excluded from the trial.
Changes in quality of tomato during storage
Ascorbic Acid
The ascorbic acid content was estimated by using spectrophotometric method.9 The 1.0 g fresh sample was extracted with 10ml of 0.4% freshly prepared oxalic acid and were then centrifuged with 8000 rpm for 20 min. The 3ml solution was maintained by the addition of 1 ml aliquots of supernatant and 2 ml of 0.4% oxalic acid afterward 7 ml of 2, 6-dichlorophenol indophenol dye solution was added. The absorbance of the test mixture was recorded instantaneously at 518nm after mixing the test solution properly.Ascorbic acid was estimated using a calibration curve prepared against a highly pure ascorbic acid.
Carotenoids
1g of the sample was ground in mortar and pestle with 80% methanol and then centrifuged. The supernatants obtained was concentrated to dryness and dried. The dried residue of the supernatant was then dissolved in 15 ml of diethyl ether. After this, 15 ml 10% methanolic KOH was added for removal of alkali the obtained mixture was then washed with 5% ice-cold saline water. The collective saline washings were extracted with ether (3:15 v/v). Both the ether extract obtained were mixed together and washed till alkali-free with cold water. The alkali-free ether extract was dried over anhydrous Na2SO4 for two hours in the dark. Using Ether as a blank absorbance of filtered alkali-free ether extract were taken at 450nm.10
Lycopene
1.0g of tomato sample, as weighed into a conical flask, was transferred into a volumetric flask and filled with distilled water to reach 100 ml mark. After, proper mixing it was transferred into a separating funnel in which 25ml of petroleum ether was also added. It was shaking vigorously for about 15 minutes. The aqueous layer was run off and the absorbance of petroleum ether layer was recorded at 505nm.11
Total Phenol
1 gm of fresh sample was centrifuged with 10 ml of 50% MeOH: H2O (1:1). 3 ml of test mixture was prepared by the addition of 1 ml of FCR (1 N), 2 ml of freshly prepared 20% Na2CO3 in 1 ml aliquots of the supernatant. The mixture prepared was then mixed properly using cyclomixer and then maintained to 25 ml with water which is then kept at room temperature for 30 minutes. After completing 30 min absorbance was taken at 725 nm. Graphs were prepared using the standardized gallic acid solution of different concentrations and total phenol content have been expressed in mg/100 gmaterial.12
Table 1: Changes in Ascorbic Acid content (mg/100gm FW) during storage under a different condition in CaCl2 treated tomato fruits
|
Hybrid (Kashi Vishesh) |
Local (Hisar Arun) |
|||||||
|
Conc. |
Temp. |
Days |
Mature green |
Breaker |
Mature red |
Mature green |
Breaker |
Mature red |
|
1% CaCl2
|
|
0 Day |
8.578± 0.274 |
14.965± 0.479 |
12.872± 0.412 |
12.127± 0.388 |
19.584± 0.627 |
15.989± 0.512 |
|
5°C |
7 Days |
9.327± 0.298 |
16.128± 0.516 |
13.804± 0.442 |
12.865± 0.412 |
20.266± 0.649 |
16.838± 0.539 |
|
|
14 Days |
10.236± 0.328 |
17.151± 0.549 |
15.004± 0.480 |
13.879± 0.444 |
21.278± 0.681 |
17.894± 0.573 |
||
|
21 Days |
9.791± 0.313 |
16.357± 0.523 |
14.356± 0.459 |
13.174± 0.422 |
20.584± 0.659 |
17.116± 0.548 |
||
|
10°C |
7 Days |
9.772± 0.313 |
16.808± 0.538 |
14.460± 0.463 |
13.251± 0.424 |
20.613± 0.660 |
17.298± 0.554 |
|
|
14 Days |
10.747± 0.344 |
17.892± 0.573 |
15.415± 0.493 |
14.218± 0.455 |
21.488± 0.688 |
18.533± 0.593 |
||
|
21 Days |
9.991± 0.320 |
16.888± 0.540 |
14.767± 0.473 |
13.531± 0.433 |
21.057± 0.674 |
17.432± 0.558 |
||
|
15°C |
7 Days |
9.821± 0.314 |
17.187± 0.550 |
14.705± 0.471 |
13.498± 0.432 |
20.911± 0.669 |
17.468± 0.559 |
|
|
14 Days |
10.972± 0.351 |
18.657± 0.597 |
16.068± 0.514 |
14.862± 0.476 |
22.383± 0.716 |
18.998± 0.608 |
||
|
21 Days |
10.351± 0.331 |
17.646± 0.565 |
15.293± 0.489 |
14.007± 0.448 |
21.440± 0.686 |
18.248± 0.584 |
||
|
2% CaCl2
|
5°C |
7 Days |
9.921± 0.317 |
16.742± 0.536 |
14.525± 0.465 |
13.354± 0.427 |
21.344± 0.683 |
17.525± 0.561 |
|
14 Days |
10.743± 0.344 |
17.914± 0.573 |
15.504± 0.496 |
14.231± 0.455 |
22.529± 0.721 |
18.598± 0.595 |
||
|
21 Days |
10.248± 0.328 |
17.264± 0.552 |
15.067± 0.482 |
13.864± 0.444 |
21.913± 0.701 |
18.078± 0.578 |
||
|
10°C |
7 Days |
10.315± 0.330 |
17.767± 0.569 |
15.381± 0.492 |
14.087± 0.451 |
22.139± 0.708 |
18.231± 0.583 |
|
|
14 Days |
11.042± 0.353 |
18.824± 0.602 |
16.147± 0.517 |
15.135± 0.484 |
23.003± 0.736 |
18.909± 0.605 |
||
|
21 Days |
10.448± 0.334 |
18.013± 0.576 |
15.561± 0.498 |
14.420± 0.461 |
22.181± 0.710 |
18.326± 0.586 |
||
|
15°C |
7 Days |
10.467± 0.335 |
18.207± 0.583 |
15.745± 0.504 |
14.917± 0.477 |
22.538± 0.721 |
18.364± 0.588 |
|
|
14 Days |
11.697± 0.374 |
19.721± 0.631 |
16.891± 0.541 |
15.973± 0.511 |
23.924± 0.766 |
19.527± 0.625 |
||
|
21 Days |
10.991± 0.352 |
18.578± 0.594 |
16.384± 0.524 |
15.343± 0.491 |
23.104± 0.739 |
18.995± 0.608 |
||
|
5% CaCl2
|
5°C |
7 Days |
10.916± 0.349 |
18.408± 0.589 |
16.285± 0.521 |
14.335± 0.459 |
23.093± 0.739 |
18.387± 0.588 |
|
14 Days |
11.717± 0.375 |
19.331± 0.619 |
17.175± 0.550 |
15.062± 0.482 |
24.033± 0.769 |
19.273± 0.617 |
||
|
21 Days |
11.023± 0.353 |
18.561± 0.594 |
16.445± 0.526 |
14.792± 0.473 |
23.524± 0.753 |
18.719± 0.599 |
||
|
10°C |
7 Days |
11.121± 0.356 |
18.674± 0.598 |
16.567± 0.530 |
15.285± 0.489 |
23.881± 0.764 |
18.767± 0.601 |
|
|
14 Days |
11.998± 0.384 |
19.625± 0.628 |
17.380± 0.556 |
15.883± 0.508 |
24.624± 0.788 |
19.732± 0.631 |
||
|
21 Days |
11.138± 0.356 |
18.804± 0.602 |
16.657± 0.533 |
15.468± 0.495 |
23.560± 0.754 |
18.949± 0.606 |
||
|
15°C |
7 Days |
11.369± 0.364 |
18.974± 0.607 |
16.845± 0.539 |
15.793± 0.505 |
24.082± 0.771 |
19.436± 0.622 |
|
|
14 Days |
12.695± 0.406 |
20.424± 0.654 |
18.286± 0.585 |
16.668± 0.533 |
25.014± 0.800 |
20.299± 0.650 |
||
|
21 Days |
11.732± 0.375 |
19.382± 0.620 |
17.346± 0.555 |
16.022± 0.513 |
24.122± 0.772 |
19.566± 0.626 |
||
All values are mean ± standard deviation (n = 3) and are significant at P=<0.05
Statistical analysis
Each treatment has been repeated thrice to reduce human error, which is evident by the similar result obtained with this exercise. All the datasets were next subjected to multifactor ANOVA with SPSS 11.0 for windows. A significant effect was assessed at 5% (p ≤ 0.05) level of significance and the mean was separated using the least significant difference (LSD) procedure.
Results and Discussions
Effect of Calcium Chloride treatment on Ascorbic Acid content of tomatoes:
Figure 1 provides a comprehensive evolution of the two varieties of tomato (named Hisar Arun and Kashi Vishesh) for a duration of 21 days when treated with a varying amount of CaCl2 concentration [1%, 2%, and 5%] and by changing the three storage temperature in the range of 5-15 degrees. For a better representation, while figure 1 shows the evolution derived in the form of relative difference (w.r.t. the value at day zero) in percentage, Table 1 provides the actual values recorded from the experiments. The evolution corresponding to Hisar Arun tomato is plotted with full lines while that corresponding to Kashi Vishesh tomato is shown in dotted. Further, as mentioned earlier, the three stages of tomato are put under investigation namely Mature Green, breaker, and full-ripe as shown in red, blue and green colors, respectively. In general, while we find the percentage increase in the ascorbic acid content in all the investigations, as following, we brief specific characteristics conclusions from this investigation.
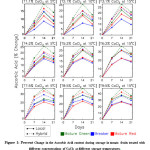 |
Figure 1: Percent Change in the Ascorbic Acid content during storage in tomato fruits treated with different concentrations of CaCl2 at different storage temperatures. Click here to View figure |
A significant increase in the ascorbic acid content up to 14 days in all stages (Mature Green, Breaker and mature red), temperatures (5°C,10°C and 15°C) and concentrations (1%, 2% and 5 % CaCl2) in both cultivars (Kashi Vishesh and Hisar Arun). On the other hand, storage after 14 days leads to a saturation in the acid content followed by a decreasing trend. From the data, it can be concluded that ascorbic acid content increased on increasing concentration of calcium chloride in all the observed condition. Breaker tomato fruit had the maximum ascorbic acid content followed by mature red and Mature Green. Maximum content (25.014 mg/100g) were found at 5% CaCl2 concentration after 14 days of analysis stored at 15 °C in Hisar Arun variety while minimum (9.327 mg/100g) were found at 1% CaCl2 concentration after 7 days of analysis stored at 5°C in Kashi Vishesh variety. From the figure, treatment with 5% concentration of CaCl2 led to a significantly higher rate (up to 40 %) of increment of the acid in all stages, temperature and both cultivars. The rate of increment was observed higher in the Mature Green stage trailed by mature red and Breaker stage in both cultivars. The rate of increase in the ascorbic acid content was found to be maximum at Mature Green stage T9 (35-45%) in both cultivars however that recorded minimum corresponding to mature red stage of Hisar Arun variety (8%).
As we can see from plot T1, the ascorbic acid content in Mature Green stage increased up to 18 % in Kashi Vishesh variety (10.236 Mg/100g) after 14 days of storage under treatment, while in the case of Hisar Arun variety, it increases up to only 15 % (13.879 mg/100g) in same time interval and then both started decreasing. Mean value of ascorbic acid content to be ranging between 15 to 23mg/100g in tomato fruits.13 Further, the range may vary within 8 and 59 mg/100 based on the cultivar variety, which agrees to the results obtained in our investigation. This reduction of nutrients and deterioration are reported to be instigated by transpiration and respiration, the key physiological processes.14 The non-linear rate of change in the AA content over the storage period of 21 days may be attributed to the oxidation process, which is understood to be caused by the catalyst and oxidizing enzymes.15 Moreover, according to some researchers,7 the reason for high ascorbic acid content in calcium-treated fruits might be that metabolic activities were fast as compared to that in untreated fruits. In this context, the increase in the content of ascorbic acid as the storage temperature is subject to an increment that is indicative of the fact that fruit is still undergoing the process of ripening,16 while a decrease in the aforementioned content indicates a senescent fruit. The ascorbic acid content in tomato deteriorated from 21.63 mg/100g at the start of the trial, attaining the minimum 13.53 mg/100g in 1.5 % CaCl2 after 9 days of storage.17 In agreement with our findings, ascorbic acid content to be increasing with the ripening of the tomatoes until a stage where the same has shown a decreasing trend.18 This suggests that harvesting the tomatoes at a suitable maturity stage may retain the nutrition level over the long storage period.
Effect of CaCl2 treatment on Carotenoid content in tomatoes during storage:
The lycopene is considered accountable for the bright red color of most fruits e.g. Pineapple, orange, lemon, grapefruit, strawberry and tomato etc.19 As tomatoes reach to the maturity stage, the carotenoid content decreases. Investigation of carotenoid content for the Hisar Arun and Kashi Vishesh cultivars revealed a generally increasing trend up to 14 days after which it starts decreasing (actual values reported in Table 2).
Table 2: Changes in carotenoids content (mg/100gm FW) during storage under a different condition in CaCl2 treated tomato fruits.
|
|
Hybrid (Kashi Vishesh) |
Local (Hisar Arun) |
||||||
|
Conc. |
Temp. |
Days |
Mature green |
Breaker |
Mature red |
Mature green |
Breaker |
Mature red |
|
1% CaCl2
|
|
0 Day |
48.785 ± 1.561 |
45.026 ± 1.441 |
42.573 ± 1.362 |
58.254 ± 1.864 |
56.473 ± 1.807 |
54.797 ± 1.754 |
|
5°C |
7 Days |
53.841 ± 1.723 |
50.179 ± 1.606 |
48.126 ± 1.540 |
62.841 ± 2.011 |
61.165 ± 1.957 |
59.973 ± 1.919 |
|
|
14 Days |
55.425 ± 1.774 |
51.939 ± 1.662 |
49.872 ± 1.596 |
64.244 ± 2.056 |
62.957 ± 2.015 |
62.032 ± 1.985 |
||
|
21 Days |
54.903 ± 1.757 |
51.233 ± 1.639 |
49.029 ± 1.569 |
63.377 ± 2.028 |
61.996 ± 1.984 |
60.739 ± 1.944 |
||
|
10°C |
7 Days |
55.186 ± 1.766 |
52.103 ± 1.667 |
49.677 ± 1.590 |
63.185 ± 2.022 |
62.672 ± 2.006 |
61.337 ± 1.963 |
|
|
14 Days |
56.643 ± 1.813 |
53.371 ± 1.708 |
51.762 ± 1.656 |
65.372 ± 2.092 |
64.402 ± 2.061 |
63.394 ± 2.029 |
||
|
21 Days |
55.854 ± 1.787 |
52.783 ± 1.689 |
50.768 ± 1.625 |
63.987 ± 2.048 |
62.772 ± 2.009 |
62.487 ± 2.000 |
||
|
15°C |
7 Days |
57.027 ± 1.825 |
54.153 ± 1.733 |
51.404 ± 1.645 |
65.873 ± 2.108 |
65.657 ± 2.101 |
63.984 ± 2.047 |
|
|
14 Days |
59.340 ± 1.899 |
56.503 ± 1.808 |
54.116 ± 1.732 |
67.459 ± 2.159 |
67.031 ± 2.145 |
65.436 ± 2.094 |
||
|
21 Days |
58.142 ± 1.861 |
54.503 ± 1.744 |
51.852 ± 1.659 |
65.191 ± 2.086 |
66.257 ± 2.120 |
64.271 ± 2.057 |
||
|
2% CaCl2
|
5°C |
7 Days |
51.826 ± 1.658 |
48.626 ± 1.556 |
47.043 ± 1.505 |
60.842 ± 1.947 |
59.583 ± 1.907 |
58.273 ± 1.865 |
|
14 Days |
53.735 ± 1.720 |
49.864 ± 1.596 |
48.358 ± 1.547 |
62.503 ± 2.000 |
60.879 ± 1.948 |
59.616 ± 1.908 |
||
|
21 Days |
52.627 ± 1.684 |
49.172 ± 1.574 |
47.762 ± 1.528 |
61.317 ± 1.962 |
59.942 ± 1.918 |
58.779 ± 1.881 |
||
|
10°C |
7 Days |
53.176 ± 1.702 |
49.827 ± 1.594 |
48.687 ± 1.558 |
62.427 ± 1.998 |
60.847 ± 1.947 |
59.815 ± 1.914 |
|
|
14 Days |
55.391 ± 1.773 |
51.871 ± 1.660 |
50.968 ± 1.631 |
64.103 ± 2.051 |
62.736 ± 2.008 |
61.937 ± 1.982 |
||
|
21 Days |
54.269 ± 1.737 |
50.593 ± 1.619 |
49.415 ± 1.581 |
63.097 ± 2.019 |
61.916 ± 1.981 |
60.525 ± 1.937 |
||
|
15°C |
7 Days |
55.943 ± 1.790 |
52.513 ± 1.680 |
51.557 ± 1.650 |
63.715 ± 2.039 |
62.548 ± 2.002 |
60.716 ± 1.943 |
|
|
14 Days |
57.917 ± 1.853 |
54.076 ± 1.730 |
53.539 ± 1.713 |
65.402 ± 2.093 |
64.503 ± 2.064 |
62.843 ± 2.011 |
||
|
21 Days |
56.356 ± 1.803 |
53.456 ± 1.711 |
52.392 ± 1.677 |
64.371 ± 2.060 |
63.643 ± 2.037 |
62.097 ± 1.987 |
||
|
5% CaCl2
|
5°C |
7 Days |
51.359 ± 1.643 |
47.975 ± 1.535 |
45.932 ± 1.470 |
60.467 ± 1.935 |
58.952 ± 1.886 |
57.667 ± 1.845 |
|
14 Days |
52.772 ± 1.689 |
49.125 ± 1.572 |
47.022 ± 1.505 |
62.356 ± 1.995 |
60.626 ± 1.940 |
59.203 ± 1.894 |
||
|
21 Days |
51.923 ± 1.662 |
48.543 ± 1.553 |
46.577 ± 1.490 |
61.268 ± 1.961 |
59.742 ± 1.912 |
58.419 ± 1.869 |
||
|
10°C |
7 Days |
51.416 ± 1.645 |
48.904 ± 1.565 |
47.831 ± 1.531 |
60.974 ± 1.951 |
59.649 ± 1.909 |
58.654 ± 1.877 |
|
|
14 Days |
53.027 ± 1.697 |
50.473 ± 1.615 |
49.274 ± 1.577 |
63.279 ± 2.025 |
61.803 ± 1.978 |
60.775 ± 1.945 |
||
|
21 Days |
52.256 ± 1.672 |
49.819 ± 1.594 |
48.721 ± 1.559 |
61.441 ± 1.966 |
60.723 ± 1.943 |
59.842 ± 1.915 |
||
|
15°C |
7 Days |
53.404 ± 1.709 |
50.772 ± 1.625 |
49.331 ± 1.579 |
62.917 ± 2.013 |
62.916 ± 2.013 |
62.218 ± 1.991 |
|
|
14 Days |
55.768 ± 1.785 |
53.816 ± 1.722 |
51.831 ± 1.659 |
65.826 ± 2.106 |
65.843 ± 2.107 |
64.389 ± 2.060 |
||
|
21 Days |
54.265 ± 1.736 |
51.513 ± 1.648 |
50.319 ± 1.610 |
64.362 ± 2.060 |
63.402 ± 2.029 |
62.747 ± 2.008 |
||
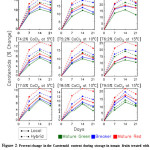 |
Figure 2: Percent change in the Carotenoid content during storage in tomato fruits treated with different concentrations of CaCl2 at different storage temperatures. Click here to View table |
Rates of increment were found to be higher in the mature red stage of Hisar Arun variety in all set of observations. From the figure 2, it can be concluded that on increasing concentration of calcium chloride, the rate of increment slows down as noted in T3 where the percentage increase is up to 27% while in T9 the same reached only up to 21%. Further, the temperature is found to play an important role in affecting carotenoid’s content during storage. At temperature 5°C the content increases slowly (8-16%) followed by that resulted for 10°C temperature (15-22%) while that corresponding to 15°C revealed maximum increment (20-27%). After 14 days of storage, carotenoids content start decreasing in all the samples under study. The increase in carotenoids can be attributed to the unmasking of the carotenoids following chlorophyll degradation during ripening of tomatoes.17 A similar trend in the carotenoids has been reported in mangoes and passions fruits.20
Effect of CaCl2 treatment on Lycopene content in tomatoes during storage
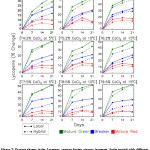 |
Figure 3: Percent change in the Lycopene content during storage in tomato fruits treated with different concentrations of CaCl2 at different storage temperatures Click here to View table |
The investigation of Lycopene content is crucial as the same is found to increases in tomato fruits during ripening. The evolution of the Lycopene content, recorded over a period of 21 days for which the tomatoes were stored, is shown in figure 3 (actual experimentally recorded values are given in Table 3).The overall evolution enables us to note that during primary stages of ripening, lycopene content progressively increased while after a certain level, the same started decreasing. Similar trends were also found in the investigation of ascorbic acid content. Lycopene content increased relatively slowly in the Kashi Vishesh variety compared with that of the Hisar Arun variety at each level of concentration, temperature, and days of storage. Further, the rate of increment in the lycopene content after 21 days of storage was found to be maximum (~ 65%) in T9 while minimum (~33%) in T1 corresponding to the Mature Green stage of Hisar Arun variety. Moreover, lycopene content is found to be maximum in all the stages treated with 5% CaCl2 followed by that for 2% CaCl2 and then for 1% concentration of CaCl2.Minimum lycopene content with the value of 0.03mg/100g in fruit when treated with 1% CaCl2 followed by 3% CaCl2 with a value of 0.06 mg/ 100g,21 in agreement to the rate of increment of the lycopene content recorded in our analysis. Further, thermal processing of tomatoes, the increase in the extractable lycopene content in processed products when compared with the fresh tomatoes.21 The change in lycopene content in the fruits and vegetables may be attributed to its reaction with free radicals. This results in disruption of polyene chain.22,23
Table 3: Changes in Lycopene content (mg/1000gm FW) during storage under a different condition in CaCl2 treated tomato fruits.
|
|
Hybrid (Kashi Vishesh) |
Local (Hisar Arun) |
||||||
|
Conc. |
Temp. |
Days |
Mature green |
Breaker |
Mature red |
Mature green |
Breaker |
Mature red |
|
1% CaCl2
|
|
0 Day |
15.651± 1.424 |
25.456± 2.316 |
34.144± 3.107 |
20.951± 1.907 |
36.482± 3.320 |
45.009± 4.096 |
|
5°C |
7 Days |
17.953± 1.634 |
27.712± 2.522 |
35.610± 3.241 |
24.850± 2.261 |
41.951± 3.818 |
48.427± 4.407 |
|
|
14 Days |
19.246± 1.751 |
28.903± 2.630 |
36.451± 3.317 |
26.635± 2.424 |
43.512± 3.960 |
49.955± 4.546 |
||
|
21 Days |
20.122± 1.831 |
29.704± 2.703 |
35.961± 3.272 |
27.958± 2.544 |
44.953± 4.091 |
49.334± 4.489 |
||
|
10°C |
7 Days |
19.545± 1.779 |
28.627± 2.605 |
36.843± 3.353 |
27.241± 2.479 |
42.273± 3.847 |
49.008± 4.460 |
|
|
14 Days |
20.849± 1.897 |
30.546± 2.780 |
38.285± 3.484 |
28.632± 2.606 |
44.331± 4.034 |
51.959± 4.728 |
||
|
21 Days |
21.879± 1.991 |
31.485± 2.865 |
37.221± 3.387 |
29.876± 2.719 |
45.762± 4.164 |
49.754± 4.528 |
||
|
15°C |
7 Days |
21.111± 1.921 |
30.635± 2.788 |
38.025± 3.460 |
28.881± 2.628 |
45.031± 4.098 |
52.178± 4.748 |
|
|
14 Days |
22.162± 2.017 |
32.273± 2.937 |
39.241± 3.571 |
30.421± 2.768 |
46.911± 4.269 |
53.337± 4.854 |
||
|
21 Days |
23.024± 2.095 |
32.741± 2.979 |
38.661± 3.518 |
31.568± 2.873 |
48.522± 4.416 |
52.603± 4.787 |
||
|
2% CaCl2
|
5°C |
7 Days |
19.382± 1.764 |
27.524± 2.505 |
35.901± 3.267 |
26.447± 2.407 |
41.422± 3.769 |
48.115± 4.378 |
|
14 Days |
20.272± 1.845 |
28.733± 2.615 |
36.291± 3.302 |
27.431± 2.496 |
42.756± 3.891 |
49.028± 4.462 |
||
|
21 Days |
21.191± 1.928 |
29.412± 2.676 |
35.983± 3.274 |
28.562± 2.599 |
43.932± 3.998 |
48.819± 4.443 |
||
|
10°C |
7 Days |
19.114± 1.739 |
28.142± 2.561 |
35.952± 3.272 |
26.863± 2.445 |
42.345± 3.853 |
49.421± 4.497 |
|
|
14 Days |
19.747± 1.797 |
29.214± 2.658 |
37.714± 3.432 |
27.889± 2.538 |
43.886± 3.994 |
51.038± 4.644 |
||
|
21 Days |
21.003± 1.911 |
30.423± 2.768 |
37.333± 3.397 |
29.577± 2.692 |
45.112± 4.105 |
50.370± 4.584 |
||
|
15°C |
7 Days |
20.324± 1.849 |
29.152± 2.653 |
36.643± 3.335 |
28.723± 2.614 |
42.475± 3.865 |
49.867± 4.538 |
|
|
14 Days |
21.049± 1.915 |
30.136± 2.742 |
38.186± 3.475 |
29.816± 2.713 |
44.833± 4.080 |
51.843± 4.718 |
||
|
21 Days |
21.924± 1.995 |
31.681± 2.883 |
37.752± 3.435 |
31.452± 2.862 |
46.699± 4.250 |
50.991± 4.640 |
||
|
5% CaCl2
|
5°C |
7 Days |
21.236± 1.932 |
28.835± 2.624 |
34.872± 3.173 |
28.754± 2.617 |
45.676± 4.157 |
48.114± 4.378 |
|
14 Days |
22.445± 2.042 |
29.726± 2.705 |
36.203± 3.294 |
30.093± 2.738 |
46.933± 4.271 |
49.431± 4.498 |
||
|
21 Days |
23.675± 2.154 |
30.963± 2.818 |
35.873± 3.264 |
31.876± 2.901 |
47.751± 4.345 |
48.873± 4.447 |
||
|
10°C |
7 Days |
21.387± 1.946 |
28.923± 2.632 |
35.443± 3.225 |
31.123± 2.832 |
46.454± 4.227 |
48.721± 4.434 |
|
|
14 Days |
23.564± 2.144 |
30.148± 2.743 |
37.745± 3.435 |
32.372± 2.946 |
47.939± 4.362 |
50.314± 4.579 |
||
|
21 Days |
24.881± 2.264 |
31.581± 2.874 |
36.903± 3.358 |
33.601± 3.058 |
48.862± 4.446 |
49.741± 4.526 |
||
|
15°C |
7 Days |
22.920± 2.086 |
29.851± 2.716 |
36.773± 3.346 |
32.611± 2.968 |
48.099± 4.377 |
49.393± 4.495 |
|
|
14 Days |
25.125± 2.286 |
31.317± 2.850 |
38.354± 3.490 |
34.433± 3.133 |
49.585± 4.512 |
50.925± 4.634 |
||
|
21 Days |
26.802± 2.439 |
32.094± 2.921 |
38.002± 3.458 |
35.991± 3.275 |
50.363± 4.583 |
49.772± 4.529 |
||
Effect of CaCl2 treatment on the Total Phenol content in tomatoes during storage
It is crucial to quantify the post-harvest change in the total phenol content of tomatoes as such extensively distributed naturally occurring substance in fruits and vegetables have the capability of scavenging superoxide and hydroxyl radical. In this regard, as shown in Figure 4, the percentage difference of total phenol content, as determined in the two varieties of the tomatoes, treated with 1%, 2% and 5% CaCl2 and subsequently stored at various temperature for 21 days while the actual recorded values of TP content are provided in Table 4. In general, we found an increasing trend until 14 days of storage in the total phenol content in tomato in the course of ripening. In particular, the same have shown a significant increase in the fruits, which were treated with 1% calcium chloride and stored at 5° C during the entire analysis. According to many authors, during initial progression phase, a reduction was found in total phenolics content in fruits where the fruit is dignified to be physiologically mature and thus prone to initiation of ripening. The presence of higher concentration of phenolics during the early stage of development provides a protection mechanism to the phytohormones like auxins, gibberellin, and cytokines,24 which plays an important role in cell division and cell enlargement. In the present investigation, the rate of falling of total phenolic was maximum (25%-10%) in T9 where the elevation rate was also large in all maturity stages in both cultivars. From the figure, we can evaluate that on increasing concentration of calcium chloride from 1% to 5%, the rate of increase of total phenolic content enhanced during storage in all maturity stages.
Table 4: Changes in Total Phenol content (mg/100gm FW) during storage under a different condition in CaCl2 treated tomato fruits.
|
|
Hybrid (Kashi Vishesh) |
Local (Hisar Arun) |
||||||
|
Conc. |
Temp. |
Days |
Mature green |
Breaker |
Mature red |
Mature green |
Breaker |
Mature red |
|
1% CaCl2
|
|
0 Day |
12.591± 0.755 |
10.876± 0.653 |
9.231± 0.554 |
16.771± 1.006 |
14.663± 0.880 |
10.997± 0.660 |
|
5°C |
7 Days |
12.660± 0.760 |
10.982± 0.659 |
9.348± 0.561 |
17.215± 1.033 |
15.174± 0.910 |
11.453± 0.687 |
|
|
14 Days |
12.714± 0.763 |
11.031± 0.662 |
9.404± 0.564 |
17.476± 1.049 |
15.416± 0.925 |
11.654± 0.699 |
||
|
21 Days |
12.626± 0.758 |
10.934± 0.656 |
9.299± 0.558 |
16.975± 1.018 |
14.909± 0.895 |
11.213± 0.673 |
||
|
10°C |
7 Days |
12.819± 0.769 |
11.155± 0.669 |
9.573± 0.574 |
17.634± 1.058 |
15.511± 0.931 |
11.750± 0.705 |
|
|
14 Days |
12.885± 0.773 |
11.252± 0.675 |
9.689± 0.581 |
17.966± 1.078 |
15.787± 0.947 |
11.942± 0.717 |
||
|
21 Days |
12.740± 0.764 |
11.074± 0.664 |
9.449± 0.567 |
17.307± 1.038 |
15.193± 0.912 |
11.498± 0.690 |
||
|
15°C |
7 Days |
12.925± 0.775 |
11.290± 0.677 |
9.713± 0.583 |
18.135± 1.088 |
16.080± 0.965 |
12.167± 0.730 |
|
|
14 Days |
13.060± 0.784 |
11.437± 0.686 |
9.867± 0.592 |
18.746± 1.125 |
16.628± 0.998 |
12.595± 0.756 |
||
|
21 Days |
12.801± 0.768 |
11.197± 0.672 |
9.606± 0.576 |
17.693± 1.062 |
15.703± 0.942 |
11.878± 0.713 |
||
|
2% CaCl2
|
5°C |
7 Days |
12.881± 0.773 |
11.213± 0.673 |
9.614± 0.577 |
17.603± 1.056 |
15.538± 0.932 |
11.747± 0.705 |
|
14 Days |
13.044± 0.783 |
11.359± 0.682 |
9.750± 0.585 |
18.035± 1.082 |
15.981± 0.959 |
12.083± 0.725 |
||
|
21 Days |
12.746± 0.765 |
11.076± 0.665 |
9.471± 0.568 |
17.255± 1.035 |
15.151± 0.909 |
11.448± 0.687 |
||
|
10°C |
7 Days |
13.012± 0.781 |
11.317± 0.679 |
9.688± 0.581 |
18.079± 1.085 |
15.908± 0.955 |
11.987± 0.719 |
|
|
14 Days |
13.202± 0.792 |
11.498± 0.690 |
9.849± 0.591 |
18.531± 1.112 |
16.333± 0.980 |
12.317± 0.739 |
||
|
21 Days |
12.822± 0.769 |
11.150± 0.669 |
9.541± 0.572 |
17.731± 1.064 |
15.582± 0.935 |
11.717± 0.703 |
||
|
15°C |
7 Days |
13.470± 0.808 |
11.764± 0.706 |
10.091± 0.605 |
18.990± 1.139 |
16.743± 1.005 |
12.732± 0.764 |
|
|
14 Days |
13.717± 0.823 |
11.988± 0.719 |
10.278± 0.617 |
19.570± 1.174 |
17.244± 1.035 |
13.026± 0.782 |
||
|
21 Days |
13.147± 0.789 |
11.470± 0.688 |
9.828± 0.590 |
18.342± 1.101 |
16.173± 0.970 |
12.215± 0.733 |
||
|
5% CaCl2
|
5°C |
7 Days |
13.041± 0.782 |
11.338± 0.680 |
9.689± 0.581 |
18.025± 1.081 |
15.930± 0.956 |
12.029± 0.722 |
|
14 Days |
13.246± 0.795 |
11.519± 0.691 |
9.850± 0.591 |
18.563± 1.114 |
16.395± 0.984 |
12.443± 0.747 |
||
|
21 Days |
12.862± 0.772 |
11.167± 0.670 |
9.508± 0.570 |
17.610± 1.057 |
15.534± 0.932 |
11.706± 0.702 |
||
|
10°C |
7 Days |
13.346± 0.801 |
11.657± 0.699 |
10.000± 0.600 |
18.918± 1.135 |
16.786± 1.007 |
12.715± 0.763 |
|
|
14 Days |
13.677± 0.821 |
11.911± 0.715 |
10.234± 0.614 |
19.604± 1.176 |
17.387± 1.043 |
13.170± 0.790 |
||
|
21 Days |
13.145± 0.789 |
11.426± 0.686 |
9.773± 0.586 |
18.265± 1.096 |
16.137± 0.968 |
12.179± 0.731 |
||
|
15°C |
7 Days |
13.648± 0.819 |
11.969± 0.718 |
10.292± 0.618 |
19.465± 1.168 |
17.270± 1.036 |
13.117± 0.787 |
|
|
14 Days |
14.093± 0.846 |
12.307± 0.738 |
10.565± 0.634 |
20.346± 1.221 |
18.040± 1.082 |
13.719± 0.823 |
||
|
21 Days |
13.155± 0.789 |
11.485± 0.689 |
9.896± 0.594 |
18.763± 1.126 |
16.554± 0.993 |
12.527± 0.752 |
||
All values are mean ± standard deviation (n = 3) and are significant at P=<0.05
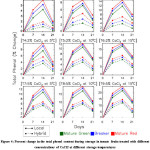 |
Figure 4: Percent change in the total phenol content during storage in tomato fruits treated with different concentrations of CaCl2 at different storage temperatures Click here to View table |
In particular, tomato fruits stored at 5°C depict slower increase rates in total phenol content in all treated samples. Soluble phenolic contents are understood to be accumulated in the main compartment of a cell namely vacuole. The effect of storage temperature reflects in the form of building up of toxic intermediate in cells owing to change in the cell membrane permeability and activity of an enzyme associated with the membrane.25 This explains the increment of total phenol content recorded in our investigation. Moreover, calcium prevents senescence-induced stress by maintaining the strength of its membrane,6 and thus delays the release of phenolic compounds.
Conclusion
Tomato is used as an integral part of the human diet. Being a climacteric fruit, the tomato is prone to irreversible changes leading to a reduction in its shelf life. Therefore, this paper investigated the evolution of non-enzymatic antioxidants of the two most commonly consumed Indian tomato cultivars namely Hisar Arun (a Local variety), and Kashi Vishesh (a hybrid variety) which were harvested at different maturity stages namely Mature green, Breaker, and Mature red and treated with varied concentration (1%, 2% and 5 %) of calcium chloride (CalCl2) at various storage temperatures 5°C,10°C and 15°C. Changes in Ascorbic acid, Lycopene, Carotenoid, and Total Phenol contents were recorded during storage and it was found that above mentioned non-enzymatic antioxidants except carotenoids increased till 14 days after which there was a decline in the quality of the parameters. On the other hand, carotenoid content in tomatoes increased up to 21 days for all maturity stages. It is to note that the rate of increase in the carotenoid content is found to be high for the mature red stage in comparison to the mature green stage.
In conclusion, tomato fruits harvested at breaker stage retained the significantly higher amount of Ascorbic Acid after 14 days of storage compared to fruit harvested at the mature green and red stage. Additionally, our investigations are suggestive of 1% CaCl2 treatment to be the most effective in terms of offering a definitive control in the rate of evolution of non-enzymatic antioxidants of the tomatoes such as lycopene and carotenoids. Further, although Hisar Arun (Local) variety is found to retain more nutritional content than Kashi Vishesh (hybrid) variety, latter shows higher shelf life.
Acknowledgements
The authors would like to acknowledge the anonymous reviewers and the scientific editors for their comments which surely improved the scientific clarity of this paper.
References
- Opadotun O. O., Adekeye S. A., Ojukwu E. O., Adewumi A. A. Comparative Analysis of Nutritional Values of Tomatoes Subjected to Different Drying Conditions. Int. J. Bas. App Sci. 2016;5(1):6-9.
- Anon. Fresh facts on retail. Whole and fresh-cut produce trends: Q2 2008. United Fresh research and Education Foundation
- Sabir F. K., Agar I. T. Influence of different conc. of 1-MCP on the quality of tomato harvested at different maturity Stages. J Sci F. Agric. 2011;91:2835–2843.
- Znidarcic D., Ban D., Oplanic M., Karic L., Pozrl T. Influence of postharvest temperatures on physicochemical quality of tomatoes (Lycopersicon esculentum Mill.) J. F. Agri. Env. 2010;8 (1):21-25.
- Senevirathna P. A. W. A. N. K., Daundasekera W. A. M. Effect of postharvest calcium chloride vacuum infiltration on the shelf life and quality of tomato (cv. ‘thilina’); Cey. J. Sci.(Bio. Sci.) 2010;39(1):35-44.
- Shiri M. A., Ghasemnezhad M., Fatahi M. J., Ebrahimi R. Enhancing and maintaining nutritional quality and bioactive compounds kiwifruit: Comparison the effectiveness of different CaCl2 spraying times. J. F. Pro. Pr. 2016; 40:850–862.
CrossRef - Gharezi M jen., Joshi N., E. Sadeghian. Effect of Post-Harvest Treatment on Stored Cherry Tomatoes; J. Nutr Food Sci. 2012;2:8.
- Choi K., Lee G., Han Y. J., Bunn J. M. Tomato maturity evaluation using colour image analysis. American Society of Agricultural Engineers. 1995;38(1):171-176.
CrossRef - AOAC. Official methods of analysis (14th edn.) Association of official analytical Chemists. 1984;23-27.
- Howe J. A., Tanumihardjo S. A. Evaluation of analytical method for carotenoid extraction from biofortified maize (Zea mays sp.). J. Agric. Food Chem. 2006;54:7992–7997.
CrossRef - Fraser P. D., Pinto M. E. S., Holloway D. E., Bramley P. M. Application of high-performance liquid chromatography with photodiode array detection to the metabolic profiling of plant isoprenoids. Plant J. 2000;24:551–558.
CrossRef - Ainsworth E. A., Gillespie K. M. Estimation of total phenolic content and other oxidation substrates in plant tissues using Folin- Ciocalteu reagent. Nat Protoc. 2007;2(4):875–877.
CrossRef - Dumas Y., Dadomo M., Lucca G. D., Grolier P. Effect of environmental factors and agricultural technologies on antioxidant content of tomatoes. J. Sci F. Agri. 2003;83:369- 383.
- Arthur E., Oduro I., Kumah P. Postharvest Quality Response of Tomato Fruits to Diff. Conc. of CaCl2 at Different Dip- Times; Am. J. F.Nutr. 2015; 5(1):1-8
- Lee S. K., Kader A. A. Preharvest and postharvest factors influencing vitamin C content of horticultural crops.Post Bio Tech. 2000;20:207–220.
CrossRef - Sammi S., Masud T. Effect of different packaging systems on storage life at different ripening stages and quality of tomato. Int. J. F. Saf. 2007;9:37-44.
- Joyce C., Owino W., Kinyuru J. &Nenguwo N. Effect of CaCl2 and Hydro-cooling on Postharvest Quality of Selected Vegetables; J. F. Res. 2016; 5:2.
- Moneruzzaman K. M., Hossain A. B. M. S., Sani W., Saifuddin M., Alenazi M. Effect of harvesting and storage conditions on the post-harvest quality of tomato (Lycopersicon esculentum Mill); Aus. J. Crop Sci. 2009 ;3(2):113-121
- Znidarcic D., Pozrl T. Comparative study of quality changes in tomato Whilst stored at different Temperatures; ActaagriSlov. 2006;87(2):235-243
- Yumbya P., Ambuko J., Shibairo S., Owino W. O. Effect of Modified Atmosphere Packaging on the Shelf Life and Postharvest Quality of Purple Passion Fruit (Passifloraedulis Sims). J. Post. Tech. 2012;02(01):025-036.
- Mujtaba A., Masud T., Butt S. J., Qazalbash M. A., Fareed W., Shahid A. Potential role of CaCl2, KMnO4 and H3BO3 on quality maintenance of tomato at ambient temperature. Int. J. Biosci. 2014; 5(9):9-20.
CrossRef - Kong K. W., Khoo H. E., Prasad K. N., Ismail A., Tan C. P., Rajab F. Revealing the Power of the Natural Red Pigment Lycopene; Molecules. 2010;15:959-987.
CrossRef
- Krinsky N. I., Johnson E. J. Carotenoid actions and their relation to health and disease.Mol Aspects Med. 2005; 26(6):459-516.
CrossRef - Shah P., Rao R. T. V. Physiological, Biochemical and Cellular Changes Associated with the Ripening of Bitter Less Bitter Gourd (MomordicaDioicaRoxb. Ex Willd.) Fruits.Int. J. Engg.Sci. 2013;7(2):2319 – 1805.
- Toor R. K., Savage G. P. Changes in major antioxidant components of tomatoes during post-harvest storage. Food Chemistry 2006;99:724–727.
CrossRef