

Introduction
Quality of soil is the significant characteristics that determine crop procurement and its suitability. Good soil is the one, which is suitable for all varieties of plants to grow on it. It is also an indicator of a good environment. To understand the soil health and to conserve it, it is always better to subject that particular soil for soil testing at least after every season. There are about twenty five parameters available to check the inherent health of any soil system but quantification of all these parameters is highly expensive, laborious and time consuming one. To resolve this issue one can make use of any soil quality index. According to eminent agricultural scientists and other experts of soil research, minimum indicators are more than sufficient to check the health of any soil system. But the number and nature of parameters may vary for different kinds of crops being grown on those soils.1 Researchers in Bishop Heber College, India have devised a Soil Quality Index called after their names as Heber Soil Quality Index (HSQI).1 In the current inspection, efforts have been made to exploit Heber Soil Quality Index (HSQI) to examine the soil fertility of a selected area for better farming of rice and sugarcane. Though there are more than twenty five parameters available to ascertain the suitability of a soil for the cultivation of sugarcane and rice, only twelve parameters are considered to be more than adequate to determine the quality according to the valuable suggestions offered by agricultural scientists, soil chemists and other experts. These are as available N, P, K, pH, water holding capacity (WHC), texture, bacterial content (BC), soil organic matter (SOM), electrical conductance (EC), bulk density (BD), Cl– content, total hardness (TH).1,2
One of the major aims of HSQI is to sort out the nutrient undersupplied areas from non-deficient ones. This message is vital to ascertain whether the soils could provide enough nutrients for best possible crop production or not. As farmers try to boost their procurement, one of the issues they ought to ask is whether the supply of fertilizer will raise the yield and whether it will be beneficial.1,2,3 The national concern would be to get the highest yield from the area under farming while the farmer’s concentration would be to make lucrative yields and not essentially the high yields. Haphazard use of fertilizer is not a solution to anyone of the issues as this not only will increase the value of crop production however additionally consequences in harmful effects on soil fertility.4,5 The idea of unprejudiced nourishment of plants additionally supervises the utilization of crop nutrients in an exceedingly explicit quantity as needed by the crops that is feasible provided that one is aware of the accessible nutrient condition of soils.6,7,8 Soil testing helps in knowing the intrinsic fertility status of the soils. In addition to this, several aspects apart from poor soil fertility might also be answerable for poor procurement and therefore, soil fertility assumes as a greater significance. Every fertilizer prescription supported a soil analysis ought to take into consideration the soil takes a look at value gained by the accurate soil analysis, the research work carried out on a crop retorts to fertilizer addition in an exceedingly specific area, the practices and level of soil administration of the concerned farmer.1 Soil testing is aimed at soil fertility analysis with resulting fertilizer recommendation is, therefore, the actual connecting link between the agronomical analysis and its usage to the farmers’ field.1,2 The major objective of this article is to enlighten the readers about how HSQI is useful to provide information about the inherent health of any soil system with reference to the cultivation of sugarcane and rice. Also it is strongly hoped that this article will instill an interest in young researchers to frame such soil quality indices to other crops thereby helping the farmers to improve the yield at low cost.
Materials and Methods
Study Area
Thiruvarur is one of the important districts of Tamil Nadu, which lies on the bank of Cauvery River (Fig. 1). Surface samples were collected from fifteen sampling sites one from each in Thiruvarur district namely Thuraiyur (1), Mathagaram (2), Alangudi (3), Amaravathi (4), Padagacheri (5), Govindakudi (6), Pudukkudi (7), Uthukadu (8), Eri (9), Manallur (10), Manakundu (11), Aavoor (12), Nadupadugai (13), Thozhuvoor (14) and Valangaiman (15).
Sampling Method
Soil samples were collected from the aforementioned area. Initially, the bulk or junk part of the soil was taken out and thrown off from each sampling site. Using a spade, soil samples were collected from the four corners and middle place (at least 15 cm) from five places of each sampling area. Five sub samples collected from each sampling area was thoroughly mixed and from the mixture, 1kg of the composite sample was taken for lab analysis. These composite samples were thoroughly cleaned to ensure that they contain no foreign substances like pebbles, roots and stones. The derived samples of each site were collected in a clean fabric bag and inscribed with the required information.2 Before, the samples were subjected to lab analyses for the above said twelve parameters (Table 2), the composite soil samples of each area were crushed to powder by using wooden hammer and sifted to get particles of 2-mm dimension.
To frame the HSQI table, statistical information was gathered from agricultural scientists, experts and eminent in this arena of research. They were advised to: (i) assemble the chosen twelve factors in the array of their significance, (ii) prepare scoring chart on a 10 – point balance with ‘0’ showing the lowest ranking and ‘10’ the highest, (iii) allot weighting curve value (Q -Value) (Table 2) and (iv) sketch the ‘Q’ graph for each pointer considering the allowable and acceptance limits of each parameter.
Test outcome, weighting factors and the ‘Q’ values were taken into an account to frame the SQI. To arrive at the SQI value for each parameter, the ‘Q’ value of that parameter is multiplied by its weighting factor. The overall HSQI for a sample is determined by adding all the SQI values. Information like various ranges of SQI values, the respective nature of soils and their suitability is presented in table 1.1 ‘Q’ values of each sample were obtained from Fig. 2 to 13.
 |
Figure 1: Map of Thiruvarur District. |
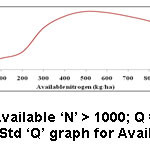 |
Figure 2: Std ‘Q’ graph for Available ‘N’. |
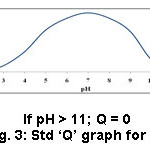 |
Figure 3: Std ‘Q’ graph for pH. |
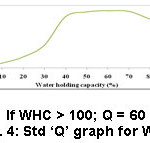 |
Figure 4: Std ‘Q’ graph for WHC. |
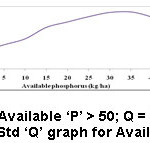 |
Figure 5: Std ‘Q’ graph for Available ‘P’. |
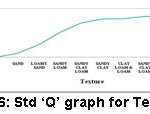 |
Figure 6: Std ‘Q’ graph for Texture. |
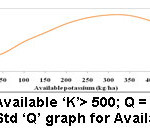 |
Figure 7: Std ‘Q’ graph for Available ‘K’. |
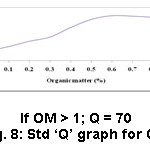 |
Figure 8: Std ‘Q’ graph for OM. |
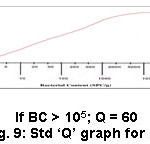 |
Figure 9: Std ‘Q’ graph for BC. |
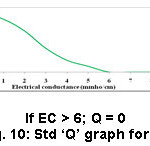 |
Figure 10: Std ‘Q’ graph for EC. |
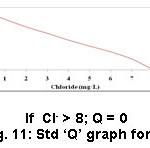 |
Figure 11: Std ‘Q’ graph for Cl– |
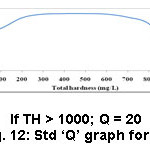 |
Figure 12: Std ‘Q’ graph for TH. |
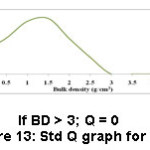 |
Figure 13: Std Q graph for BD. |
Results and Discussion
The outcome of the results is presented in the tables 3-5. The overall HSQI values of all soils were determined to be in the range of 72.36 – 83.83. This reveals that the quality of soils examined in this study is good for the better growth of sugarcane and rice.
Amongst the various samples studied, sample 14 (Thozhuvoor) had maximum ultimate HSQI value, 83.83 (Table 5). In this sampling site, the outcomes of the parameter like available ‘N’ (455 kg/ha), pH (7.4), WHC (45.94 %), texture (sandy clay loam), SOM (0.59 %) and EC (0.08 mmho/cm) are found to be excellent and they are in accordance with the best favorable values needed for the most excellent farming of sugarcane and rice. The HSQI values of available ‘N’, pH, WHC, SOM and EC were found to be extremely good with 9.12, 9.31, 8.56, 8.37, 7.98 and 7.45 respectively. The parameters such as available ‘P’ (152.5 kg/ha), ‘K’ (425 kg/ha) and bulk density (1.29 g/cm3) contribute reasonably to the soil quality of this sample with the HSQI values of 5.40, 6.96 and 6.49 respectively. Bacterial content, Cl– content and total hardness do not significantly contribute to the quality of this sample.
The sample 4 (Amaravathi) registered with the low HSQI of 72.36 (Table 3). This sample was rated good for the better growth of sugarcane and rice. The pH (6.9), WHC (50.74 %), texture (clay loam), SOM (0.48 %) and EC (0.56 mmho/cm) were found to be good as per the limit. The HSQI values of pH, WHC, texture, SOM and EC were found to have 9.41, 8.84, 8.19, 7.14 and 7.06 respectively. The parameters such as available ‘P’ (285 kg/ha) and bulk density (1.23 g/cm3) contribute fairly to the quality of this sample with HSQI values of 5.40 and 6.49, respectively. The test outcome of available ‘N’, available ‘K’, Cl–, TH and BC do not contribute much to the quality of the soil. This vividly informs us that this sample has a serious shortfall of available ‘N’, ‘P’ and ‘K’.
The best possible amount of ‘N’ for a better farming of sugarcane and rice in Indian soil culture is >328kg/ha (Table 2). Available ‘N’ of the studied soils in this examination ranges from 112-455 kg/ha. This range indicates that most of the soils were very low in nitrogen. Nitrogen insufficiency results in a yellowing of the leaves because of declining chlorophyll.3 ‘N’ may be reused by upcoming plants in the form of crop remains and manures stored in the soil. The pH of soil can influence the positive role of useful micro-organisms. The degradation of SOM may be decreased down in acidic soils. The soils had the pH from 6.3 – 8.3, which reveals that they were little acidic to fairly alkaline. From this range of pH it is realized that the speed of volatilization is maximum. Texture of soil samples represents clay loam and silty clay loam, which indicates that the rate of evaporation is moderate as these soils can retain soil specks firmly. EC values (0.05-0.56 mmho/cm) of soil samples support the argument that the rate of volatilization is high. Volatilization losses could be evaded by, (i) irrigation to the soil instantly following the addition of urea (ii) maintains soil humidity.
Soils with high pH (alkaline soils) is not favorable for the growth of sugarcane and rice because micro nutrients such as Zn, Cu, Mg, B and P are less accessible in soils (ii) huge levels of ‘Na’ in soils adversely impacts growth (iii) Ca (Ca2+) forms coordination compound with ‘P’ that makes it out of stock to the soil.4 The pH of all samples was in the range of 6.3- 8.3 revealing that they were acidic to alkaline. The pH prescribed for the better procurement is 4.5 – 8.0 (Table 2). Soil sample 11 (Manakundu) registered high pH (8.3), which indicates that this sample is basic (Table 5) and sample 1 (Thuraiyur) showed low pH (6.3), which divulges an information that it was acidic (Table 3). Other soils were found to have intermediary pH values. Hence, as far as pH is concerned, the sugarcane and rice crop are better grown in acidic soils in range of 6.0 – 7.0 due to the maximum microbial activity, which in turn make nitrogen and phosphorus more available.
Available WHC is nothing but the quantity of water that the soil can retain. Good quality soils have high available water holding capacity, which supply excess water to plants. Clay loam and silty soils can retain more water than sandy soils.5 WHC could be enhanced by; (i) the supply of SOM to soils either from compost (ii) dung (iii) cover crop (iv) reduced tillage in long term manner. WHC of the samples selected in this examination was found to be between 42.34 and 52.18 %. As per the prescriptions of the eminents, soils with 40-55 % of WHC (Table 2) is good for the plantation of sugarcane and rice form which better yield is expected. Almost all the samples analyzed in this study had the optimal range (42.34-52.18 %), which is in accordance with the range (40-55 %) suggested by experts. Sample 10 (Manallur) and sample 2 (Mathagaram) recorded high (52.18 %) (Table 4) and low (42.34%) (Table 3) WHC values, respectively.
Several vital characteristics of soils are associated with their texture. For instance, clay soils display huge WHC, high flexibility, adhesiveness and bulging; whereas sandy soils are obvious by the deficiency of these characteristics. Texture impacts the growth of vegetation and supply of nutrients. WHC and soil quality are related to texture of the soil.6,7,8 When texture of the inspected soils in this study is considered, they reported as clay loam and silty clay loam types.
‘P’ is a vital requirement for the growth of any plant. It stores power in plant cells that is significant for photosynthesis. ‘P’ quantity can be improved by rigorous fertilization of cash crops like cotton, tobacco and peanuts and addition of green composts and biosoilds in soils. From the management practices, decrease runoff and soil attrition could be reduced by terraces, tillage methods and reduce ‘P’ run-off. The prescribed value of available ‘P’ is >30 kg/ha (Table 2). ‘P’ of the soils investigated in this task ranged from 48.75 – 430 kg/ha, which reveals that all soil samples had excessive ‘P’ content.7
Potassium is another vital nutrient absolutely indispensable for plant growth. It is engaged in the working function of enzymes that are accountable for several anatomical plant processes. It offers a pivotal role in nutrient and carbohydrate transportation in the plant. It is significant for water irrigation in the plant and improved winter hardihood of legumes. Plants need more ‘K’ than any other elements as well as nitrogen.3 Available ‘K’ is found in soil water and readily exchangeable form by organic matter and clay. Deficiency of ‘K’ leads to (i) produced stunted and developed poor root systems (ii) begins with symptoms of interveinal chlorosis (iii) bronzing near the edges of lower leaves and developed into a firing and moves inward until the entire leaf dies and are shed, when the short fall continues (iv) reduced the carbohydrate production (v) premature defoliation (vi) belated development (vii) declined yield (viii) plant death. The deficiency of ‘K’ could be reduced by (i) executing good soil management methods (ii) maintain good pH to increase soil cation exchange capacity (iii) building soil organic residues (iv) using split application to minimize leaching losses on soils with less cation exchange capacity.25 The optimum value of available ‘K’ for the better cropping is > 305 kg/ha (Table 2). The samples registered ‘K’ in the range of 112.5-937.5 kg/ha. The sample 11 (Manakundu) recorded high (937.5 kg/ha) (Table 5) and sample 4 (Amaravathi) showed low (112.5) (Table 3) values of available potassium.
SOM may be a complicated, various element including living and dead plants, animals and micro organisms and materials created by these bacteria and their degradation.9 SOM could be minimized considerably by tillage method, whereas tilling oxygen inspires or flow up the action of soil microbes that take advantage of an organic matter and also the process continues large amount of organic matter is burnt off.10 SOM can be enhanced by the addition of cover crops, green manure crops. Compost is an extremely similar composition of SOM when adds compost to soil and breaks down gradually and maximizes soil health. The most favorable range of SOM for the better farming is 0.34-0.95 % (Table 2). All the soils tested in this inspection had SOM in the range of 0.29 – 0.78 %. The sample 2 (Mathagaram) showed high (0.78%) (Table 3) and sample 6 (Govindakudi) presented (Table 4) low organic matter (0.29%). The BC of soils in this piece of investigative task was determined to be in the range of 11000 – 9300000 SPC/g this shows the condition of soil better for the cultivation of sugarcane and rice.
Productivity of soil is taken into account as a pivotal issue for the accomplishment of crop procurement instead of soil productiveness. Soil productivity is based on many factors among that the role of microbes is outstanding. Microorganisms are numerous like archaea and protozoa. The valuable microorganisms in soils such as cyanobacteria, rhizobacteria, mycorrhiza perform numerous jobs like promoting plant growth, fixing ‘N’ in the soil, providing disease resistance and stress tolerance to the plants providing and helping the degradation of soil particles etc.11,12,13,14 Soil microorganisms (Flora and Fauna), rather like superior plants depend wholly on the soil for their nutrition, growth and activity.15 The BC of the soil samples in this examination was estimated to be in the range of 11 x 103-93 x 105 SPC/g. The recommended best possible value is 107 – 108 SPC/g (Table 2). The sample 15 (Valangaiman) had high (93 x 105) (Table 5) and sample 3 (Alangudi) showed low (11 x 103) (Table 3) BC values. All other examined samples have judicious soil BC. Liming of acid soils increases activities of bacteria and actinomycetes.
Electrical conductance is a dimension that interrelates various characteristics of soils, which impact procurement including texture, cation exchange capacity, drainage conditions, SOM and salinity.16,17,18,19 EC of the soils recorded between 0.05 and 0.56 mmho/cm. The most possible quantity of EC recommended by experts is < 1 mmho/cm (Table 2). The sample 4 (Amaravathi) showed huge EC value (0.56 mmho/cm) (Table 3) and sample 8 (Uthukadu) had poor value of EC (0.05 mmho/cm) (Table 4). All other tested samples determined good electrical conductivity. The values of parameters such as Cl– content (1.2- 5.6 mg/L), soil textured (clay loam and silty clay loam), water holding capacity (42.34-52.18 %) of the samples analyzed, which are in support of for good electrical conductivity of soil samples.
Cl is the most copious constituent of the halogen family.20 Cl– is vital for osmotic regulation and increase yields of cereal crops. Excess Cl– uptake influences the degree of hydration of plant cells and poises the charge of positive ion cation transportation. Plants having lesser quantity of Cl– than the optimal value will tend to undergo drooping of leaf tips, a progressive chlorosis and leaf necrosis, which will result in plants failing to form fruit.21 Toxicity of chloride in plants more often because soil water contains such a high concentration of dissolved substances due to the accumulation of chloride in water, which is unavailable for plant uptake. Healthy plants generally have 70-100 ppm Cl– on dry weight basis but may have 20,000 ppm without undesirable impacts.22 Cl– content of the samples was estimated to be in the range of 1.2 – 5.6 mg/L. The most favorable value of Cl– content for the better procurement of sugarcane and rice is < 4mg/L (Table 2). The sample 7 (Pudukkudi) tested high value of chloride (5.6 mg/L) (Table 4) and the sample 1 (Thuraiyur) showed low (1.2 mg/L) (Table 3). As far as electrical conductivity values are concerned, all samples show good electrical conductivity values.
The TH of the investigated soils was found to be between 32 – 84 mg/L. The suggested finest quantity of TH is <1.5 mg/L (Table 2). Sample 7 (Pudukkudi) had maximum TH (84 mg/L) (Table 4) and sample 1, 6 and 15 (Thuraiyur, Govindakudi and Valangaiman) presented low value (32 mg/L) (Table 3, 4 and 5). Almost all samples were found with acute hardness, which is a pointer of low yield for the crops like sugarcane and rice.
Soil bulk density is a gauge of compactness of soil and its soil. It influences permeation, rooting boundaries of soil, WHC, porosity, nutrient accessibility and the activity of soil micro organism, which affect key soil practices and crop procurement.23 Bulk density classically amplifies with soil depth because subsurface covers have more packed and less SOM, accumulation and root infiltration compared to surface covers.24 BD of the soils examined in this study is found to have the ranged from 1.13-1.30 g/cm.3 The most favorable range of BD values for better farming of sugarcane and rice is 1.23 – 1.50 g/cm3 (Table 2). The sample 10 (Manallur) registered high bulk density value (1.30 g/cm3) (Table 4) and sample 6 (Padagacheri) registered low value (1.13 mg/cm3) (Table 4). As far as soil texture is concerned, all tested samples were clay loam and silty clay loam, which showed that the bulk density values were < 1.30 g/cm3 and almost all the samples had good water holding capacity. Considering the parameter bulk density almost all samples are considered good for the cultivation of sugarcane and rice.
Table 1: Classification of soil quality on the basis of HSQI.
|
Range |
Quality of Soil |
Expected Yield |
|
>90 |
Excellent |
Excellent yield is anticipated. The soil can contribute much more than the entire crop nutrient requirement. |
|
71 – 90 |
Good |
75-90% of the crop yield potential is expected without addition of the indicated nutrient. Yield increase to the added nutrient will be expected. A small portion of the nutrient requirement must come from fertilization. |
|
50 – 70 |
Medium |
50-74% of the crop yield potential is expected without addition of the indicated nutrient. Yield increase to the added nutrient is expected. |
|
<50 |
Bad |
Less than 50% of the crop yield is expected without the addition of the indicated nutrient. |
Table 2: Methods of determination, optimum range and weighting factor of various parameters.
|
Parameter |
Methods of determination |
Optimum range |
Weighting factor |
|
Available ‘N’ (kg/ha) |
Alkaline permanganate method 26 |
>32838 |
0.095 |
|
pH |
Electrometric method 27, 28 |
4.5 – 8.039 |
0.095 |
|
WHC (%) |
Weight loss method 29 |
40 – 5540 |
0.093 |
|
Available ‘P’(kg/ha) |
Olsen’s method27,30 |
> 3038 |
0.090 |
|
Texture |
International pipette method 31 |
Clay and Clay loam39 |
0.089 |
|
Available ‘K’(kg/ha) |
Flame photometer method 31, 32, 33 |
>30538 |
0.087 |
|
OM (%) |
Walkley and Black method34 |
0.34 – 0.9541 |
0.084 |
|
BC (SPC/g) |
Standard plate count method |
108 – 109 42 |
0.082 |
|
EC (mmho/cm) |
Digital conductometric method 27, 31 |
< 143,44 |
0.076 |
|
Cl– (mg/L) |
Titrimetric method 27, 35 |
< 445 |
0.075 |
|
TH (mg/L) |
Titrimetric method 36 |
< 1.546,47 |
0.070 |
|
BD (g/cm-3) |
Clod Method 37 |
1.23 – 1.541 |
0.069 |
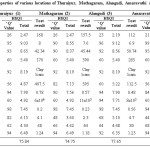 |
Table 3: Soil properties of various locations of Thuraiyur, Mathagaram,Alangudi, Amaravathi and Padagacheri. |
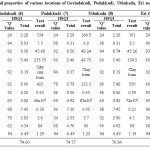 |
Table 4: Soil properties of various locations of Govindakudi, Pudukkudi, Uthukadu, Eri and Manallur. |
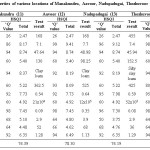 |
Table 5: Soil properties of various locations of Manakundru, Aavoor, Nadupadugai, Thozhuvoor and Valangaiman. |
Conclusion
The chief basis of earnings for the farmers residing in Thiruvarur district, India, depends on the growth of cash crops like sugarcane and rice. Highly useful and newly formulated HSQI was exploited in this study to rate the soil samples collected from fifteen places of Thiruvarur district as excellent, good or bad with special orientation to sugarcane and rice cultivation. The ultimate HSQI values of soils studied were found to be between 72.36 and 83.83 revealing that they are in good quality. Therefore, this newly designed HSQI table is useful as it is less time consuming and more interpre table by soil experts so that they can offer appropriate and constructive suggestions to the local farmers. This work is believed to be really beneficial and may result in better farm management through more cost effective nutrient decisions. Not only that, this sort of a work may serve as an eye opener for the young researchers to take up a similar soil index work for other crops.
Acknowledgements
The authors express their heartfelt gratitude to the Principal and the management of Sir Theagaraya College, Chennai-21 and the Director, Research and Development Centre, Bharathiar University, Coimbatore-46 for rendering all possible helps as when approached.
References
- Gugan S., Ramesh Kumar C., Rajendran A., Princy Merlin J., Jeyakar chellaraj. Formulation of a new Heber Soil Quality Index for sugarcane and rice cultivation. Pollut Res. 2001;19(3):485 – 489.
- Muthuvel P., Udayasoorian C., Natesan R., Ramaswami P. R. Introduction to soil analysis. 1992;10 – 60
- Hodges S. C. Soil Fertility Basics, Soil Science Extension North Carolina State University certified Crop Advisor Training. 1995.
- Patriquin D. E., Blaikie H., Patriquin M. J., Yang C. On-farm measurements of pH, electrical conductivity, and nitrate in soil extracts for monitoring coupling and decoupling of nutrient cycles. Bio Agric Hortic. 1993;9:231-272.
CrossRef - Brady N. C., Weil R. R. The Nature and Properties of Soils. Eleventh eds. Prentice Hall, Upper Saddle River, New Jersery. 1996;40-160.
- Brady N. C. Weil R. R. The Nature and Properties of Soils, Thirteenth eds. Prentice Hall. Upper Saddle River, New Jersey. 2002;36 – 129.
- Brady N. C., Weil R. R. The Nature and Properties of Soils, fourteenth eds. Prentice Hall, London. 2008;345 – 362.
- Lipiec J., Hatano R. Quantification of compaction effects on Soil physical properties and crop Growth. Geoderma. 2003;116:1-2.
CrossRef - Nelson D. W., Sommers L. E. Total Carbon, Organic Carbon and Organic Matter, Methods of Soil Analysis, Part (3), Chemical Methods, pp. 180-260. In: D. L. Sparks, et al., eds., SSSA, Madison. 1996.
- Wuddivira M. N., Stone R. J., Ekwue E. I. Clay Organic Matter and Wetting Effects on Splash Detachment and Aggregate Breakdown under Intense Rainfall. Soil Sci Soc Am J. 2009;73 (1):226-232.
CrossRef - Alegre J. C., Pashanasi B., Lavelle P. Dynamics of soil physical properties in Amazonian ecosystems inoculated with earthworms. Soil Sci Soc Am J. 1996;60:1522-1529.
CrossRef - Day S. D., Bassuk N. L. A review of the effects of soil compaction and amelioration treatments on landscape trees. Arboric J. 1994; 20(1):9-17.
- Watson G. W., Kelsey P. The impact of soil compaction on soil aeration and line root density of Quercus palustris. Urban For Urban Gree. 2006;4(2):69-74.
CrossRef - Magdoff D. H., Startsev A. D. Effects of compaction on aeration and morphology of boreal forest soils in Alberta, Canada. Can J Soil Sci. 2009;89(1):45-56.
CrossRef - Baath E. Estimation of fungal growth rates in soil using 14C- acetate incorporation into ergosterol. Soil Bio & Bio chem. 2001;33:2011-2018.
CrossRef - Borbe M. A. A. A., Doran J. W., Drijber R. A., Dobermann A. Soil electrical conductivity and water content affect nitrous oxide and carbon dioxide emissions in intensively managed soils. J Environ Qual. 2006;35:1999-2010.
CrossRef - Fargo N. D., Maas E. V., Hoffman G. J. Crop salt tolerance-current assessment. J Irrig Drain Div. 1977;103:115-134.
- Jung W. K., Kitchen N. R., Sudduth K. A., Kremer R. J., Motavalli P. P. Relationship of apparent soil electrical conductivity to clay pan soil properties. Soil Sci Soc Am J. 2005;69:883-892.
CrossRef - Farahani H. J., Buchleiter G. W., Brodahl M. K. Characterization of apparent soil electrical conductivity variability in irrigated sandy and non-saline fields in Colorado. Am Soc Agric Eng. 2005;48(1):155−168.
- Engel R., Bruckner P. L. Mathre D. E., Brumfields S. K. Z. A chloride deficiencies leaf spot syndrome of wheat. Soil Sci Soc Am J. 1997;61:176-184.
CrossRef - Heckman J. R. Corn stack root suppression and grain yield response to chloride. J Plant Nutr. 1998;21:149-155.
CrossRef - Schulte E. E. Soil and applied chlorine. Fact sheet A3556. Madison, I: University of Wisconsin co-operative Extension service. Science Society of America. 1999.
- Grossman R. B., Reinsch T. G. Bulk Density and Linear Extensibility, Methods of Soil Analysis, Part (4), Physical Methods, Third eds. In: Dane, J. H., Topp, Eds, G. C., SSSA, Madison. 2002;201-228.
- Campbell D. J., Henshall J. K. Bulk Density, Soil Analysis, Physical Methods, Marcel Dekker, eds. In : K.A. Smith and C. E. Mullins, New York. 1991;329-366.
- Tal B. A., Feigenbaum S., Sparks D. L. Potassium salinity interactions in irrigated corn. Irri Sci. 1991;12:27–35.
- Subbiah B. V., Asija G. L. A rapid procedure for the estimation of nitrogen in soils. Curr. Sci. 1956;25:259-260.
- Davis J., Freitas F. In Physical & Chemical Methods of Soil & Water Analysis, FAO of United Nations, Rome. Soil Bull.1970;10(III-1):68-70.
- Singh., Dhyan., Chhankar P. K., Pande R. N. Electrical Conductivity in Soil, Water analysis Method Manual, IARI, ICAR, New Delhi. 1999;14-16.
- Soil Testing Procedure Manual. Marathwada Agricultural University, Parbhani. 2008;22.
- Olsen S. R., Sommers L. E. Phosphorous in method of soil analysis, Part-2, Chemical and microbiological properties – Agronomy monograph number 9 (2nd Ed.). American Society of Agronomy, Inc, Soil Science Society of America, Inc, Madison, Wisconsin, USA. 1982;24:421–422.
- Ghosh A. B. Bajaj J. C., Finanul Hasan., Dhyan Singh. Soil and water testing methods, Laboratory Manual, ICAR Publication. 1983;21-22
- Knudsen D., Peterson A. G. Lithium, Sodium and Potassium, In A.L. Page (Ed.) Methods of Soil Analysis. Agronomy Monogram No. 9, American Society of Agronomy, Inc. Soil Sci. Soc. Of America Inc. Publisher Madison WB Consin, USA. 1982;225-246.
- Somawanshi R. B., Tamboli B. D., Patil Y. M., Kadu P. P. Twenty Five years of Research on soil test Crop Response Studies in Maharashtra. 1968 – 1993,1994; M.P.K.V. Res. Publ. No. 14.
- Page A. L., Miller R. H., Keeny D. R. Organic Carbon in Methods of Soil Analysis, Chemical & Microbiological properties, American Society of Agronomy, Inc, Soil Science Society of America, Inc, Madison, Wilconsin, USA. 1982;9(2):570-571.
- Jackson M. L. Chloride Determination, in Soil Chemical Analysis, Prentice hall of India Pvt. Ltd., New Delhi. 1967; 10:261-263.
- Nelson R. E. Carbonate and Gypsum, In A. L. Page (Ed.). Methods of Soil Analysis, Part-2. Agronomy. American Society of Agronomy Ins. Soil Science Society of America Inc., Madison Wisconsin. 1982;9:181-197.
- Kadam J. R., Shinde P. B. Practical Manual on Soil Physics – A method manual, Department of Agricultural Chemistry and Soil Science, Rahuri. 2005;24.
- Yadav R. L., Kamta Prasad K., Gangwar K .S. Prospects of Indian Agriculture with special reference to nutrient management under irrigated systems. In: Long-Term Fertility management through Integrated Plant Nutrient Supply (Eds. A. Swarup, D. Damodar Reddy and R.N. Prasad), Indian Institute of Soil Science, Bhopal, India. 1998;1-335.
- Thiyagarajan K., Kalaiyarasi R. Status paper on rice in Tamil Nadu. Centre for Plant Breeding and Genetics, Tamil Nadu Agricultural University, Coimbatore, Tamil Nadu. 2011;1-20.
- Majumdar D. K. Irrigation Water Management by, Prentice Hall of India. 2000;1-18.
- Mandal K. G., Kundu D. K., Ravender Singh., Ashwani Kumar., Rajalaxmi Rout., Jyotiprakash Padhi., Pradipta Majhi., Sahoo D. K. Cropping practices, soil properties, pedotransfer functions and organic carbon storage at Kuanria canal command area in India. Springer Plus. 2013;2:631 1- 14.
- Hoorman J., Islam R. Understanding Soil Microbes and Nutrient Recycling. Fact Sheet SAG –16 -10. Ohio State University Extension. 2010;1-5.
- Dahnke W. C., Whitney D. A. Measurement of soil Salinity, In Recommended soil chemical test procedures for the North Central Region. 1988;32-34.
- Smith J. L., Doran J. W. Measurement and use of pH and electrical conductivity for soil quality analysis. In J.W. Doran and A.J. Jones (ed.) Methods for assessing soil quality. Soil Science Society of America Spec. Publ. 49. SSSA, Madison, WI. 1996;169-185
- Horneck D. A., Sullivan D. M., Owen J. S., Hart J. M. Soil Test Interpretation Guide. Oregon State University. Extension service. 2011;1-12.
- Tucker C. S. Carbon dioxide in T.L.Wellborn, Jr. and J.R. MacMillan (eds.) For Fish Farmers 84-2. Mississippi Co-operative Extension Service. 1984.
- Wurts W. A., Durborow R. M. Interactions of pH, carbon dioxide, alkalinity and hardness in fish ponds. Southern Regional Aquaculture Center. 1992;464