

Introduction
Wheat and rice remain in top of the list of the major staple foods in India and Government of India is a largest buyer of it.1 Its production and procurement has grown immensely over the last few decades as a result of shift in cultivation of high yielding varieties and procurement policies framed by the Government of India.2 As per Food policy of India, the benefit of farmers was focussed primarily during procurement by providing Minimum Support Price (MSP) for food grains they produced.3 For each agricultural marketing season, Government announces a set of prices as per the recommendations of Commission for Agricultural Costs and Prices (CACP) at which it guarantees to procure wheat and rice, even if market prices fall below the announced price.4,5 The MSP has been hiked by 79.4 % for wheat and paddy in terms of rice by 118.60% including bonus in the past decade. Procurement of foodgrains is performed by Food Corporation of India (FCI) along with State Government agencies on behalf of GOI through the procurement centres (grain mandies) at MSP rate from the farmers6,7 which are conforming to quality specifications issued for every season by the Department of Food and Public Distribution (DFPD).
Punjab is one of the major agrarian States in India, which comprises 4.2 million hectare of cultivable area and envisaged asa major centralized procurement state, contributing around 38.60% and 22.10 % in country’s total production of wheat and rice respectively.8,9 It is largely a rural state with 72% of population in rural areas and has the lowest percentage of people below the poverty line and highest life average expectancy.10 The state has been divided into three geographical regions such as, the northern sub-montane strip, central plains and South Western region. The sub-montane region consists of districts of Gurdaspur, Hoshiarpur and Rupnagar with annual rainfall of about 870 mm and the agriculture productivity is low compared to other two. Central plains a most productive region with 570 mm of annual rainfall, comprises of Amritsar, Kapurthala, Jalandhar, Ludhiana, Patiala and parts of Sangrur. The south western region includes Ferozepur, Bhatinda, Faridkot and part of Sangrur, with annual rainfall of 230 mm. They follow double cropping system with Rabi or spring harvest(June to August) for wheat and barley and Kharif or autumn harvest(October and November) for paddy.11
Green revolution increases the productivity of foodgrains in the country, including Punjab in last 50 years by cultivation of high yielding seed varieties, tube well irrigation (98%), enhanced power and credit availability to the farmers by State Government.12 Their average production of wheat and rice per year stands for 3880 kg/ha and 3130 kg/ha respectively. Around 70% of wheat is procured from 75-80% of production as marketed surplus and of 98% of rice produced 85% is procured and remaining are traded privately with the intervention of government in procurement and marketing.13 Further, for the central pool, the state contributes around 35 % and 32% of its wheat and rice production respectively.14 There are around 226 FCI procurement centres and 1576 procurement centres for Punjab State agencies.15
The PDS in India is a largest distribution system in world and its complexity involves various entities viz., FCI, State Government Agencies (SGAs), Railways, transporters and contractors. Several studies have been focussed on functioning of procurement centres, storage activities and the PDS.16,17 The food grains which are procured undergo storage process for one or two year before its issue to people and has been exposed to different biotic and abiotic factors which deteriorates the quality.18 Henceforth, it is mandatory to adopt the norms from the initial stage since from its procurement. Quality is defined, as it depends on the consumers and the intended end use for the grain and the quality grain is that which meets the end user specifications with respect to range of predetermined quality and safety standards. Supplying good quality foodgrains to avoid malnutrition is being envisaged in National Food Security Act, 2013.19 In view of operations and functioning of grain wholesale markets or grain mandis as per the Agricultural Produce Market Committee (APMC) Act, 1960 with special reference to quality specifications adopted during the procurement, a survey was carried out in Punjab considering as a model state where, procurement centres are functioning quite efficiently.
Materials and Methods
Survey and Collection of Samples
In three geographical zones of Punjab, three districts were selected in each zone. Samples were collected directly from grain mandis/procurement centres during procurement season viz., wheat during mid-April to May and paddy during end of October to November. The survey and selection of the sampling method is adopted as per Brewer20; Rodriguez et al,21 where, applied earlier for agriculture produce.
In each major procurement centres of the districts, fifteen farmers were selected at random irrespective of variety of cultivar and from the lot/market arrival which is kept for procurement by FCI/State agencies after their cleaning operations, Samples of 500g each were collected as per IS:14818 methods.22 A total of 450 samples i.e. 150 samples per zone were collected during April’ 2008 to March’ 2016. They were labelled carefully, brought to the laboratory at Indian Grain Storage Management Research Institute, Ludhiana and analysed for the content of various refractions in the sample.
Quality Parameters
The grain samples were analysed for their physical quality parameters categorized as per the uniform specifications issued by DFPD, GOI during the procurement season of Kharif and Rabi marketing season every year.
In 500g of paddy and wheat samples, the percentage content of various refractions such as, moisture, foreign matter, other food grains, damaged grains, slightly damaged grains, discoloured, karnal bunt, shrivelled grains, broken grains, admixture of lower class and weevilled grains were analysed as per IS 4333.23 The methodology adopted is described under.
Moisture Content
The moisture content of paddy and wheat were measured by adopting Hot Air Oven method, in which the samples of paddy were oven dried at 130 to 1330C for 2 h and after drying, the sample was placed in desiccators for 30-45 minutes. Based on the difference in weight of the sample before and after drying, the percentage moisture content of paddy was determined.
Foreign matter/dockages
The samples of paddy and wheat were analysed for percentage content of foreign matter viz., organic and inorganic matter. 500g of paddy/wheat sample was transferred to a sieve set, which comprises of sieves of various mesh sizes (4.00 mm, 3.35 mm, 1.70 mm, 1.00 mm)as per IS 460.24 The sieve set was agitated to strain out the foreign matter at various levels. After straining for 1-2 minutes, the organic and inorganic foreign matters were removed using forceps and taken in a petri-dish (19mm). The total contents were weighed and recorded. The total percentage of foreign matter content in the sample was calculated as below.
Percentage of foreign matter=[(wt. of organic+inorganic)/ wt. of sample] x 100.
Other Refractions
The percentage content of other refractions in wheat such as, other food grains, damaged grains, slightly damaged grains, karnal bunt, shrivelled grains, broken grains, were analysed. In respect of paddy, damaged, discoloured, sprouted, immature, shrunken, shrivelled grains, admixture of lower class were analysed.
After straining the sample in sieve set, the foreign matter free sample was spread evenly of circular layer (6-10mm thickness) in a smooth flat surface. The samples were scooped from various sides and test samples weighing 50 g each of paddy and wheat were taken. The weighed quantity of test sample spread over in an enamel plate (dia:300mm). The refractions were separated and grouped. The segregated refractions were weighed individually. The percentage content of each individual refraction was calculated from the weight of test sample taken for analysis.
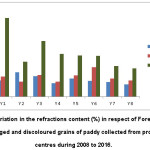 |
Figure 1: Variation in the refractions content (%) in respect of Foreign Matter (FM), damaged and discoloured grains of paddy collected from procurement centres during 2008 to 2016. |
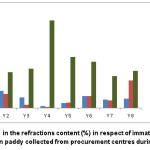 |
Figure 2: Variation in the refractions content (%) in respect of immature, shrunken and shrivelled grains in paddy collected from procurement centres during 2008 to 2016. |
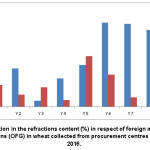 |
Figure 3: Variation in the refractions content (%) in respect of foreign matter (FM) and other food grains (OFG) in wheat collected from procurement centres during 2008 to 2016. |
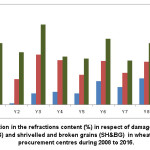 |
Figure 4: Variation in the refractions content (%) in respect of damaged (DG), slightly damaged (SDG) and shrivelled and broken grains (SH&BG) in wheat collected from procurement centres during 2008 to 2016. |
Weevilled grains
The weevilled grain content was measured in samples of wheat by volumetric method. 20 ml of sample was taken from the sieved sample and transferred to an enamel plate. The weevilled grains were identified by the presence hole in their surface which caused by an insect/weevil, Sitophilusoryzae. They were picked out separately on visual examination and counted. The percentage content of insect/weevilled damaged grains was calculated as under.
![]()
If percentage of weevilled grains exceed >3.5%, then weight method is adopted by calculating the weight of weevilled grains in the total weight of the sample (20g) taken for analysis.
Data analysis
The study was carried out statistically by randomized collection of samples. The results obtained were statistically analysed by ANOVA and post-hoc test was carried out by adopting Turkey’s Multiple Range Comparison method (p<0.05) to determine the significant difference between the different zones. The entire calculations on quality parameters were performed in XLSTAT software package version 2015.
Results and Discussion
In the present study upon analysis of the samples of paddy and wheat collected from the grain mandies/ procurement centres in Punjab during the period of 2008-2016 reveals that the quality norms adopted for procurement of paddy and wheat were conformed to Uniform specifications laid out by GOI during the respective periods.
Table 1: Zone-wise details on the refractions content (%) in paddy observed in Punjab.
| Paddy |
Percentage of refractions* |
||||||
|
FM |
Damaged |
Discoloured |
Immature |
Shrunken |
Shrivelled |
Moisture |
|
|
Zone1 |
0.77 ±0.06b |
0.85 ±0.06b |
2.31 ±0.64b |
0.48 ±0.06a |
0.31 ±0.18b |
1.10 ±0.36b |
17.38 ±0.36b |
|
Zone 2 |
0.72 ±0.04a |
0.90 ±0.09a |
1.91 ±0.24a |
0.33 ±0.07a |
0.25 ±0.17ab |
1.35 ±0.32a |
17.20 ±0.32a |
|
Zone 3 |
0.80 ±0.13a |
0.91 ±0.12a |
1.87 ±0.12a |
0.22 ±0.19a |
0.39 ±0.16a |
1.56 ±0.20a |
16.89 ±0.20a |
| * Average of refractions observed during 2008-2016. ^Values are in Mean ± S.E from the values of total 1200 samples per zone for eight years. Mean followed by same alphabets in superscript are not differ significantly according to Turkey’s Multiple Comparison test (p< 0.05). | |||||||
The zone wise details on the content of refractions in paddy and wheat collected from the procurement centres during the study period 2008 to 2016 was pooled and their average of 1200 samples per zone was presented in Table 1 and Table 2 respectively. In paddy, the Foreign matter (FM) content was in the range of 0.77±0.06 (zone 1) to 0.80±0.13 (zone 3). Damaged grains were found higher in zone 3 as 0.91±0.12 whereas discoloured grains were higher in zone 1 as 2.31±0.64. The immature, shrunken and shrivelled grains lie more or less similar in the three zones. The moisture content detected by Hot Air Oven method was higher in zone 1 as 17.38±0.36 %. Similarly, in wheat the moisture content was observed to lie higher in zone 1 as 10.42±0.54%. The other refractions content of wheat such as, FM, other foodgrains, damaged, karnal bunt, slightly damaged, shrivelled and broken grains lies in same range between the three zones with no major variation (Table 2).
Table 2: Zone-wise details on the refractions content (%) in wheat observed in Punjab during 2008 to 2016.
| Wheat |
Percentage of refractions *^ |
|||||||
|
FM |
Other food grains |
Damaged |
Karnal burnt |
Slightly damaged |
Shrivelled &brokens |
weeviled |
Moisture |
|
| Zone1 |
0.38 ±0.12b |
0.16 ±0.03b |
0.92 ±0.29b |
0.02 ±0.02a |
2.08 ±0.34b |
3.28 ±0.31b |
0.0 ±0.0 |
10.42 ±0.54b |
| Zone 2 |
0.35 ±0.07a |
0.19 ±0.06a |
0.90 ±0.30a |
0.00 ±0.0a |
2.47 ±0.36a |
3.84 ±0.28a |
0.0 ±0.0 |
9.68 ±0.33a |
| Zone 3 |
0.34 ±0.09a |
0.12 ±0.05ab |
0.87 ±0.20a |
0.01 ±0.01a |
2.24 ±0.20a |
3.72 ±0.39a |
0.0 ±0.0 |
9.68 ±0.34a |
| * Average of refractions observed during 2008-2016. ^Values are in Mean ± S.E from the values of 45 samples from each zone. Mean followed by same alphabets in superscript are not differ significantly according to Turkey’s Multiple Comparison test (p< 0.05). | ||||||||
The data obtained from three zones for the entire study period was pooled to represent the whole of Punjab and the variation in refraction content year-wise(2008 to 2016) are presented in Fig 1 and Fig2 for paddy and wheat in Fig 3 and Fig 4. In case of paddy, the refractions observed during the study period varied in content of foreign matter (total of organic and inorganic) (0.55 to 1.02%), damaged grains (0.68 to 1.33%), discoloured grains (1.28 to 3.54 %), immature grains (0.07% to 0.60%), shrunken grains (0.12 to 0.98%) and shrivelled grains (0.44 to 3.09%). In wheat, the foreign matter content was in the range of 0.33% to 0.60%, other foodgrains as 0.07% to 0.36%, 0.05% to 1.67% for damaged foodgrains, in karnat bunt as 0.02% to 0.4%, slightly damaged grains as 1.16% to 3.17% and as 2.80 to 5.30% for shrivelled and broken grains.
The average moisture content of paddy varied from 16.09% to 18.87% and wheat lies in the range of 8.70% to 11.32 % (Fig 5). No paddy and wheat were procured from farmers with beyond the limit on content of refractions as framed by GOI in the Uniform Specifications for paddy and wheat. Since, paddy subjected to milling process and period of storage in depots was for short duration, majority of the lots were accepted as per the specifications laid out by Government of India.
The year wise trend showed that the refractions of the samples collected from mandies were under the specifications formulated by the Government. The slight variation in the moisture content of samples was due to the method adopted viz. Hot Air Oven method. In procurement centres/mandies Universal Moisture Meter was used for calculating the moisture content of the sample which is approved by the GOI to save time during such huge operations. Similar to the present study, Suganthi and Nacchair25 observed the percentage of damaged food grains in paddy of Kerala region lies in the range of 1.26% to 1.8% and its dockage at 0.22% to 0.33%. Apart from quality norms, on comparing the production and procurement of paddy and wheat in Punjab, an increasing trend was observed in their procurement from 128.2 Lakh Tonnes (2008-09) to 164.96 (2016-2017) for paddy and 99.41 (2008-09) to 106.45 (2016-17) for wheat.15 On taking into account of the quantity procured, the percentage against the State’s production, a considerable increase in procurement of paddy from 78.11% (2008) to 87.69% (2017) was observed. While in case of wheat, no such variation in its trend was observed during the same period. Such variation might be due to the increase of MSP for paddy of common variety during 2008-09 to 2016-1714 which has been announced by the GOI on keeping the increasing trend of farm inputs and to safeguard the interest of farmers. In Punjab, the effective implementation of price policy seems to have considerable effect on the production and productivity of foodgrains.26
The main feature of agriculture price policy in India is that, they are mainly focused on the restriction in movement of food grains between procurement regions of surplus States and deficient States, distribution and rationing in urban areas and administrative control over traders.27 Ensuring the quality of foodgrains during their storage, movement becomes mandatory until it reaches the consumers. A long chain of intermediaries and multiple middlemen act as a principal bottleneck in the commodity system.28 The supply chain for rice and wheat to reach the consumers via PDS differs slightly in the country.29 Rice is procured as paddy from farmers and it involves two ways of procurement. Levy channel procurement of rice which predominates >60% before 1990s by Government of India. Now the Customed Milled Rice (CMR) channel has been emphasized and levy procurement is almost nil.30 Wheat is stored and issued as a whole grain, whereas, the procured paddy is stored, milled and issued as milled raw rice or parboiled rice. The quality norms for rice is different for milled raw rice /parboiled rice and the quality of rice depends upon the quality of paddy procured.10
The organic impurities in the form of dockage make the grain more susceptible to stored grain insects and fungal attack.23 Shrunken grains due to their higher rate of respiration provide favourable conditions for deteriorative changes by insects, microorganisms and enzymatic reactions and also affect the percentage of head rice yield during milling process.31,32 Dirt/dockage present in the foodgrains also effect the penetration power of the fumigants. Keeping in view of it, the cleaning of foodgrains has been emphasised in the procurement centres/mandies of Punjab and the lots are procured after cleaning.33 Appropriate pre-harvest care of the crop in the fields and post-harvest care of the grain is essential not only to minimise the subsequent quantitative losses but also to reduce shrunken/shrivelled, discoloured and damaged kernels as also the dockage, which bring down the quality, resulting cut in the market value and affecting milling yields and quality of end-products.25 In view of the proper care of grain at various levels from fields to the consumer’s table Etemadnia et al.,34 developed the Mixed Integer Linear Programming (MILP) model for efficient transfer of food from production region to consuming region.16 The direct supply of food grains by farmers in the procurement centres in Punjab has increased the control over quality by the farmers itself which has been achieved by the increased awareness among them as suggested by Mangala and Chengappa.35
The procurement system involves an effective and workable set of standards and associate grades which are utilized in exchange for acquisition of grains. Despite of several measures taken by the Government towards the supply of good quality of foodgrains through PDS, due to various reasons in supply chain, such as negligence of staffs and natural abiotic factors viz., flood and unexpected rainfall, the quality of food grains sometimes gets deteriorated and issued to the consumers after upgradation of the stocks.15 The variations in the trend of refractions in the study in respect of damaged grains and moisture level is due to the climatic factors experienced during the period. Due to advancement of technology, the procurement of paddy and wheat has been shifted to bulk storage (Silos) in Moga district of Punjab, where the food grains with high moisture are dried in a drier and transported in bulk to reduce its loss in quality.16
In the pre-harvest stage and post-harvest stage, unavoidable deterioration in quality may happen in the foodgrains during harvesting period and insect/fungal attack may occur due to climatic factors. Keeping this in view, to avoid distress sale by farmers, the specifications formulated by GOI gets relaxed during erratic climatic situations, specific to those affected states. The study also ascertained the refractions limit framed in Uniform Specifications by the GOI and the limit prescribed every year found to be appropriate for the market arrivals of paddy and wheat in Punjab. Besides, FCI has been performing all the marketing functions to sub-serve the national objective of safeguarding the interests of farmers through remunerative prices as well as of consumers providing good quality food grains at affordable prices.31,36
Conclusion
This paper examines the quality standard of food grains viz., paddy and wheat procured from farmers in the mandis/procurement centres of Punjab. A grain saved is a grain produced. Around thousand crores of rupees value of foodgrains are wasted in the country every year. Ensuring the quality of food grains from its initial stage i.e. procurement in its supply chain is a vital one. At many instances, the damage of foodgrain are reported during the storage operations but the damage caused depends upon the quality of procurement. Hence, surveying the quality of procurement from one of the high procurement State reveals the condition of it. In the present study, among the various refractions content, the percentage of foreign matter and moisture in paddy and wheat were found to be close to the upper limit of specifications framed by GOI. The procured wheat are directly reached to the consumer’s hand through PDS after storage in depots, while paddy is subjected to milling. The content of foreign matter and moisture favours damage of food grains during supply chain. The facilities such as electric sieving machines and driers are made available only in few centres, while mechanically operated sieves are still under practice in most of the centres. To reduce the content of foreign matter during such huge time bound operations, it should be made available to the farmers to a greater extent in all procurement centres.
As a whole, the quality of paddy and wheat procured in Punjab, seems to be at par with the specifications framed by the GOI and reflects the regulated functioning of agriculture markets in Punjab and the positive impact of the various revamp initiatives of the Government. It also depicts the certainty of refractions limit fixed by GOI to avoid distress sale of farmers without affecting the wholesome value of food grain which is distributed through PDS. Certain constraints on the less availability of market infrastructure viz., covered and open auction platforms, grain driers have to be improved further so that, quality food grains will reach the deficit states from the surplus food grain producing State of Punjab.
Acknowledgement
The authors thank the Storage and Research Division of Ministry of Consumer Affairs, Food and Public Distribution, New Delhi for providing financial support.
References
- Kattumuri R. Food Security and the Targeted Public Distribution System in India, LSE Asia Research Working Paper 38. London School of Economics, London. 2011;40-78.
- Gupta N. Government intervention in grain markets in India: rethinking the procurement policy. Working paper No.231. Centre for Development Economics, New Delhi. 2013;1-53.
- FGB. Foodgrains Bulletin and earlier Issues, Department of Food & Public Distribution, Ministry of Consumer Affairs, Food and Public Distribution, Govt. of India. 2017;4-15.
- DFPD. Annual report-2015 of Department of Food and Public Distribution, Krishi Bhawan, New Delhi. 2015;4-10.
- Mishra P. The Food Security Act (FSA) Fiscal Implications: 2013-14 to 2015-16. Yojana. 2013;57:8-12.
- Chand S. Ramesh R. Minimum support price in agriculture – Changing requirements, Economic and Political Weekly. 2003;38(29):3027-28.
- Rammohan A. Food Security in India and Food Security Bill. Yojana. 2013;57:35–37.
- Vatta K., Aggarwal M. Pattern of growth of major agricultural crops in Punjab, Agricultural Situation in India. 2000:57(2):81-84.
- DoA. Economic Survey report 2016 – 2017 of Department of Agriculture, Punjab. 2017:1-17.
- Singh I. P., Bal H. S., Singh B., Kumar N. Price policy for wheat and paddy vis-à-vis equity in Punjab, Indian Journal of Agricultural Economics. 1986:41(4):611-16.
- Ghuman R. S., Rangi P. S., Sidhu M. S. Losses Suffered by the Farmers of Punjab since 1967-68 due to Non-linking of the Procurement Price of Wheat and Paddy with the Price Index, Report submitted to the Punjab Government, MSP and Price Index Committee. 2009:1-76.
- Grover. Economic profile of rice cultivation in Punjab. Indian J. Agric. Res. 2013:47(4):335 – 340.
- Sidhu M. S., Gaganjot Singh. A Study on Staggered Public Procurement of Wheat in Punjab. Agricultural Economics Research Review. 2010:23:325-334.
- DFPD. Annual report-2017 of Department of Food and Public Distribution, Krishi Bhawan, New Delhi. 2017;10-17.
- FCI. Agency-wise Procurement of Wheat, Paddy and Rice during Last Five Years, Food Corporation of India, New Delhi. 2017.
- Mogale D. G., Kumar S. K., Tiwari M. K. An MINLP model to support the movement and storage decisions of the Indian food grain supply chain. Control Engineering Practice. 2018;70:98-113.
CrossRef - Jha S., Shikha B., Ramaswami. How can Food Subsidies Work Better? Answers from India and the Philippines, ADB Economics Working Paper series No 221, Asian Development bank, Manila, Philippines. 2010:1-34.
- Parikh K. S. Food Security Bill-Would it wipe out Hunger and Malnutrition? Yojana. 2013;57:18–21.
- Sengupta P., Mukhopadhyay K. Economic and Environmental Impact of National Food Security Act of India. Agricultural and Food economics. 2016:4(5):1-23.
- Brewer K. R. W. Design-based or prediction-based inference?. Stratified random vs. stratified balanced sampling. International Statistical Review. 1999:67:35-47.
CrossRef - Rodríguez E., Lupín B. M., Lacaze V. Consumers perceptions about food quality attributes and their incidence in Argentinean organic choice. International Association of Agricultural Economist Conference, Gold Coast, Australia, August. 2006;12-18:1-12.
- IS 14818. Method of sampling of Cereals and Pulses. Bureau of Indian Standards, New Delhi. 2000:1-24.
- IS 4333. Methods of analysis for foodgrains. Part 1- Refractions. Bureau of Indian Standards, New Delhi. 2016:1-9.
- IS 460. Test Sieves: Part-2 Perforated Plate Test Sieves. Bureau of Indian Standards, New Delhi. 1985:1-19.
- Suganthi A., Nacchair F. Quality Parameters of different Varieties of Paddy/Rice grown in Vadakkanchery, Kerala. Int. J. Advan. Pharm. Bio. Chem. 2015;4(2):405-408.
- Shayequa Z. Alia., R. S. Sidhub., Kamal Vattac. Effectiveness of Minimum Support Price Policy for Paddy in India with a Case Study of Punjab. Agricultural Economics Research Review. 2012:25(2):231-242.
- Dutta B., Ramaswami B. “Targeting and Efficiency in the Public Distribution System: Case of Andhra Pradesh and Maharashtra.” Economic and Political Weekly. 2001:5:1524–32.
- Gaikwad V. R., Sambrani S., Prakash V., Kulkarni S. D., Murari P. Post Harvest Management In: State of the Indian famer, Department of Agriculture and Co-operation, New Delhi. 2004:67-92.
- Tarozzi A. The Indian Public Distribution System as a Provider of Food Security: Evidence from Child Nutrition in Andhra Pradesh. European Economic Review. 2005:49:1305–1330.
CrossRef - DFPD. Annual report-2016 of Department of Food and Public Distribution, Krishi Bhawan, New Delhi. 2016:4-15.
- Whitaker T. B., Dickens J. W. Variability of aflatoxin test results. J Am Oil Chem Soc. 1974:51:214-218.
CrossRef - Rezitis A. N., Ntinou A. G., Pachis D. N. Investigating the international prices of wheat and rice. Agricultural and Food economics. 2015:3(18):1-17.
- Kochar A. Can Targeted Food Programs Improve Nutrition?An Empirical Analysis of India’s Public Distribution System. Stanford Centre of International Development, Stanford University. 2003:1-57.
- Etemadnia H., Goetz S. J., Canning P., Tavallali M. S. Optimal wholesalefacilities location within the fruit and vegetables supply chain with bimodal transportationoptions: An LP-MIP heuristic approach. European Journal of Operational Research. 2015:244(2):648–661.
CrossRef - John A. Price relations between international markets. Agricultural and Food economics. 2014:2(1):1-16.
- Mangala K.P., Chengappa P. G. A Novel Agribusiness Model for Backward Linkages with Farmers:A Case of Food Retail Chain. Agricultural Economics Research Review. 2008:21:363-370.