

Introduction
Soybean is one of the important oil seed crops which are playing the significant role in the production of soya meal in India. This crop has a significant place in nine oil seed crops in the world due to its higher yield, prosperity and imperative involvement towards maintaining soil productivity. About 80 per cent of the world’s soybean is produced by US, Brazil and Argentina. International soybean production of 346.919 million metric tons (mmt) has grown at a Compound annual growth rate (CAGR) of 5.0 per cent in 2016-17. India fifth position in soybean production in the world and contribution was about 15.51 per cent in the total oil production of 2018.1,2 Soybean has mostly been answerable in enriching farmer’s financially viable status in country.1,2 It usually fetches higher income to the farmers owing to the massive export market for soybean de-oiled cake. At present, 1.07 mmt of soybean was exported. The soybean production was decreased from 3.252 mmt in 2013-14 to 1.700 mmt for the harvesting season of 2017-18.1 But consumption of soya meal has increased from 4225 thousand million tons in 2014-15 to keep tempo with the growing demand it is necessary to enhance the productivity of soybean. In the country, Madhya Pradesh (50.100 lakh ha) and Maharashtra (34.484 lakh ha) has more than 80 per cent area and production. It can be distinguished that the productivity of soybean in Maharashtra is higher than that in Madhya Pradesh. Maharashtra state has 7.3 per cent (at current price) contribution in agriculture and allied activities in 2017-18.1,2 The Maharashtra state occupies 75 per cent area and 85 percent production under nine oil seed crops in which 7 per cent area and 10 per cent production of soybean crop. This study attempts to evaluate the price behavior of soybean in the Amravati district of Maharashtra due to major soybean producing state with higher productivity
With reference to price forecasting there are few studies such that mainly focuses on the production and prodctivity issue of the different crops (Darekar and Reddy, 2018).4,5 The present paper takes up new dimensions to study which includes the issue of analyzing the seasonality and price forecasting with reference to select soybean crop. To this particular purpose, use the statistical techniques like seasonality and exponential smoothing for price forecasting. The processing of data was done through MS- Excel and MINITAB Software. Based on this analysis it was observed that there is inverse relationship between price and market arrivals of soybean.
The entire paper is organized as follows,
1. Introduction
2. Conclusion
3. Policy Implication
4. References
Methodology
Among all the oil seeds, soybean covers approximately 80% of total area in the Maharashtra state. Amravati region has produced around 41.7 per cent of soybean so this region was purposely selected for the price behavior study.2 The is based on the secondary data. The monthly wholesale prices and arrivals data for the study collected from the agmarknet.gov.in for the period January 2008 to December 2017.3 To analyze the data, use the statistical techniques like seasonality and exponential smoothing for price forecasting. The processing of data is done through MS- Excel and MINITAB Software. Amravati market has highest arrivals of soybean. The study period was analyzed for the evaluation of price behavior of soybean. The variety of price forecasting models were tried to evaluate the appropriate model. Also here we use the seasonal indices for studying the price and arrival behavior. The monthly wholesale prices data of Amravati APMC for study period were used for price prediction and data for ensuing period i.e. from Jan.2018 to April 2018was used for validation. The important points are given below:
Computation of seasonal indices
The 12 months moving average of original data with multiplicative mode of time series analysis were used for seasonal analysis.6
P= T x S x C x I…………….. (i)
Where,
P= Monthly price
T= Trend value
C= cyclic component
S= seasonal component
I= Irregular component
The sum of the seasonal indices should be 1200, if it is greater or less than 1200 then it is adjusted by using a correction factor i.e.
K= 1200/S
Where,
K = Correction factor
S = Sum of seasonal indices
Extent of intra year pries rise (IPR)
The difference between the lowest and the highest prices within the year is termed as intra year price rise (IPR). The prices of most commodities usually remain the lowest in the harvest season and rise thereafter till they reach the highest level in the next pre-harvest season.
Average seasonal price variation (ASPV)
The average seasonal price variation was determined as used in the earlier by Sharma and Burark (2015). The average seasonal price variation was computed using the following formula.7,8
![]()
Where,
ASPV = Average seasonal price variation
HSPI = Highest seasonal price indices
LSPI = Lowest seasonal price indices
This coefficient has some advantages over IPR and indicates the average variations in prices during the year.
Coefficient of variation
The coefficient of variation was calculated as explained by Sharma and Burark (2015). 7,8
It expresses the variability of the prices from its average. It indicates or measures the stability of a given parameter. It was computed by using the formula:
![]()
Where,
SD = The standard deviation
AM = Mean of the seasonal indices
Since the mean of seasonal indices is 100, then the coefficient of variation is the magnitude of standard deviation.
Price forecasting
Exponential smoothening model
For smoothing the common techniques discussed by Gardned4 i.e. Single exponential smoothing (SES) and double exponential smoothing (DES) are used.
Single exponential smoothing(SES)
For the time series Y1,Y2,……..,Yt forecast
Ft+1 = F1+ (Y1– F1)
Where
Yt+ 1= for the next value (based on the weights α and (1-α) )
Y1 = recent observation
F1 = recent forecast
Double exponential smoothing (DES)
The form of the model is
Lt = α Yt+ (1-α) (Lt-1 + bt-1)
b t = β(Lt – Lt-1 ) + (1-β )bt-1
Ft + m = Lt + b t m
Where,
Lt is level of series at time t.
b t is slope of the series at time t.
α and β (= 0.1,0.2,…………0.9) are the smoothing and trend parameters.
The pair of values of parameters, α and β, which gives minimum MSE are taken.
Criteria measurement for forecast error
The time series are analyzed by giving different models and the best exponential model in each case is selected, based on minimum Mean square error (MSE), Mean absolute percent error (MAPE) and Mean absolute deviation (MSD) values under different measure have been used.
Results and Discussion
Seasonality of monthly arrivals and prices were calculated by using the moving average technique for the period of 2008 to 2017 (Table 1). It was observed that the arrival pattern of soybean in different months of the year had impact on price. The highest seasonal index (273.9) of arrivals of soybean was observed during the month of November in Amravati market. It can be observed that through the seasonal indices of arrivals in soybean in Amravati market were more than 100 during October to January the peak period of arrival was found during October(266.98), November(273.9) and December(186.43) and lower arrival indices (Fig.1) were observed during July (7.77) and August (12.65). The values of high price indices for soybean were recorded in May (109.58) and lowest price index was noted during October (89.21) in Amravati market. The price indices of soybean were lower than 100 for seven months i.e. September to March, remaining month’s prices were moderate in Amravati market.
Table 1: Seasonality of monthly arrivals and prices of soybean in Amravati market in 2008 to 2017
| Months (2008-2017) | Average price of each month in respective year | Average arrivals of each month in respective year |
|
Jan |
98.42 |
148.22 |
|
Feb |
99.24 |
83.19 |
|
March |
99.10 |
63.88 |
|
April |
107.68 |
62.33 |
|
May |
109.58 |
35.87 |
|
June |
104.37 |
33.70 |
|
July |
100.71 |
07.77 |
|
August |
103.88 |
12.65 |
|
September |
96.36 |
25.09 |
|
October |
89.21 |
266.98 |
|
November |
97.75 |
273.90
|
|
December |
93.69 |
186.43 |
Source: www.agmarketnet.gov.in
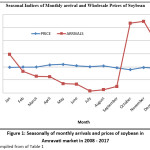 |
Figure 1: Seasonally of monthly arrivals and prices of soybean in Amravati market in 2008 – 2017 Click here to View Figure |
Source: Compiled from of Table 1
The values of maximum price indices for soybean were found in May (109.58) and lowest price index was recorded in October (89.21) in Amravati market. The prices indices of soybean were lower than 100 for seven months i.e. September to March. (Sharma and Burark,2015).8 Thus, both rainfed and irrigated conditions soybean crop can be grown. Most part of Maharashtra soybean grown under rainfed condition, which is harvest in the month of October. It was noticed that during the period of October to January has accounted highest arrivals market. Thus, it was observed that arrival had opposite relation with the price of soybean. Similar results were reported by different study (Sharma & Burark, 2015)8.
The lower values of indices were observed during the period from September to March indicates lean period in Amravati markets. Most of the farmers were sold the produce just after harvest due to lack of storage facility and cash obligation. On the other hand, farmers who have storage facility look forward for advantageous period for higher prices. The price movement also demonstrates noteworthy seasonal fluctuations in selected markets. The highest values of price indices were observed during incline arrivals month of June to September and in lingering months prices were moderate in Amravati market.
Extents of Seasonal Price Variation
The extents of seasonal price variation were determined by using different measures of intra year price variations. With a view to ascertain the difference in the magnitude of the seasonal variations in the soybean, the analysis was carried out in term of IPR. ASPV and C.V. for this purpose, the magnitude of fluctuations in seasonal indices of soybean were measured with the help of the co-efficient of average seasonal prices index variation (Table 2).
Table 2: Co-efficient of average seasonal price disparity in Amravati market
| Crop | IPR | ASPV | C.V |
|
Soybean |
20.37 |
20.49 |
23.77 |
Source: Author’s Calculation
The average seasonal price variation (ASPV) was recorded 20.49 per cent in the market and coefficient of variation (C.V) was recorded 23.77 per cent. As the co- efficient of variation increased, the degree of stability of prices decreased. The variability in fresh arrivals stock of the products in market and the demand affects the price to a great extent. Keeping such variations in demand in view, the soybean producer can achieve remunerative price by corresponding supply to the market requirements.
Price forecasting of soybean
Table 3: Different exponential smoothing criterion for soybean forecast model
| Model | MAPE | MAD | MSD |
|
SES |
6.35 |
185.7 |
85584.68 |
|
DES |
6.14 |
168.3 |
75047.18 |
|
Winters Model |
10 |
281 |
143115 |
Source: Author’s Calculation
From the table 3 observed that the Double exponential smoothing technique was most appropriate for soybean price forecast because in DES model the value of MAPE, MAD and MSD was lowest.
Table 4: Truthfulness of forecast price of soybean
(Rs. /Quintal)
| Month and year | Actual wholesale price | SES (Forecasted) | DES (Forecasted) | Winter model (Forecasted) |
|
Jan- 18 |
3142.84 |
2614.32 (83.18) |
2688.85 (85.55) |
2355.91 (75.96) |
|
Feb-18 |
3357.42 |
2614.32 (77.45) |
2682.15 (79.89) |
2265.08 (67.11) |
|
Mar- 18 |
3435.4 |
2614.32 (76.10) |
2675.46 (77.88) |
2235.78 (65.80) |
|
Apr- 18 |
3314.51 |
2614.32 (78.87) |
2668.76 (80.52) |
2256.51 (68.08) |
Figure in parentheses are the percentages of respective actual prices.
Source: Author’s Calculation
From the table 4 show that the truthfulness of different forecasting prices, which were compared with the actual price in the market. The actual price data of soybean from period January 2018 to April 2018 are used for the validation of forecasted price and actual price. As a result, here the correctness percentage varies from 80.52 to 85.55 per cent based on double exponential model. The prevailing price as compared to other predicted model prices varied from 78.87 to 83.18 per cent case of the single exponential smoothing (SES), while the actual percentage for winter’s model it varies from 68.08 to 75.96 per cent. From the observed, the analysis and conclude the Double exponential model was the suitable model for soybean price forecast in APMC of Amravati for selected period and as per the same model examined by Meera and Sharma.6
Conclusion
The study of price fluctuation of soybean crop overtime is important for formulating a resonance agricultural policy. Price of soybean was found negative relationship in price and market arrival. The soybean is mostly kharif crop but also grown in rainy season. The high arrivals were started during October to January. The highest price observed in month of August during the period of pre harvesting of soybean, which market arrivals very low in quantity. The assessment of all three forecasting models was carried out in the procedure based on Double Exponential model with MAD (168.3) and MAPE (6.14) values, which were considered to be least. The accurate value among the predicted price and prevailing price of soybean were found in between 80.52 to 85.55 per cent. So, DES the most appropriate model was observed for soybean price forecasting. This study can be used for further research in the field of market intelligence and production forecast for achieve better price.
Policy Implication
Considering the seasonality in prices, particularly for soybean farmers should adjust their sowing season to take advantage of higher prices according to demand and supply through the season. As per the forecasted prices, farmers can produce onion and tomato crops in all the seasons looking into resource availability and profitability compared to the competing crops. Further, they can sell the produce immediately after harvest to fetch a remunerative price. Adequate and continuous efforts should be made to disseminate the market intelligence and market information, particularly of price forecast to help the stake holders. There is a need to establish a few processing units to create value addition to the selected commodities. These would help the farmers to get better income on the one hand and reduce price fluctuation on the other hand.
Acknowledgement / Funding
Author thankful to Chhatrapati Shahu Institute of Business Eeducation & Research, Kolhapur (CSIBER), Shivaji University and Agro-Economic Research Centre AERC, Vallabh Vidyanagar, Anand, Gujarat 388120.
Conflict of Interest
The authors do not have any conflict of interest.
References
- http://www.sopa.org
- https://eands.dacnet.nic.in
- www.agmarknet.gov.in
- Darekar, A., Reddy, A. A. Oilseeds Price Forecasting: Case of Mustard in India. Agricultural Situation in India, (2018):1-7.
- DAREKAR, A., & REDDY, A. A. Price forecasting of pulses: case of pigeonpea. Journal of Food Legumes, (2017): 42-46.
- Meera and Sharma Hemant, Seasonality and Exponential Smoothing Models for Price Forecasting of Rice in Selected Market of Uttar Paradesh. Agricultural Situation in India (2017): (VOL. LXXIII): 18-2
- Sharma, H., & Burark, S. A study of seasonal price behaviour and market concentration of maize in Rajasthan. International Reserach Journal of Agricultural Economics and Statistics, (2015): 282-286.
- SHARMA, H., & BURARK, S. Comparison between Exponential Smoothing and Artificial Neural Network Price Forecast Model for Moong Crop in Sumerpur Market of Rajasthan. The Journal of Rural and Agricultural Research, (2014):14 (2),1-4, 1-100.
- Gardner, E.S. Exponential Smoothing – The state of the Art.. J. Forecasting, (1985): 4, 1-28.
- Basavaraja, H. Behaviour of price of market arrivals of major crops in Bijapur. Indian Journal of Agricultural Marketing 1993: 7(2):149-159
- Pawar, N.D. and Misal, D.H. Behaviour of prices and arrivals of pomegranate in western Maharashtra. Agric. Markt 2004. 47(4): 22-24.